Figures & data
Figure 1 Treatment timeline for CRKP infection.
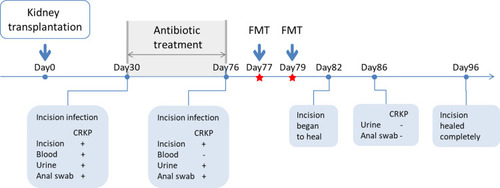
Figure 2 Surgical incision and renal function indexes in the patient post-FMT. (A) Surgical incision for kidney transplantation in the patient. (B) Serum creatinine and blood urea nitrogen (BUN) levels.
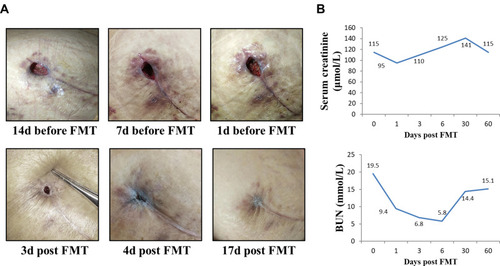
Figure 3 Alpha and beta diversity of the gut microbiota of the donor and the patient pre- and post-FMT. Histograms compared Chao1 index (A) and Shannon index (B) of the fecal microbiome in the donor and the patient pre- and post-FMT. PCoA plots showed the microbial community variation of the donor and the patient pre- and post-FMT based on weighted UniFrac distance (C) and unweighted UniFrac distance (D). FMT 1W, FMT 3W and FMT 2M represented 1 week, 3 weeks and 2 months after FMT.
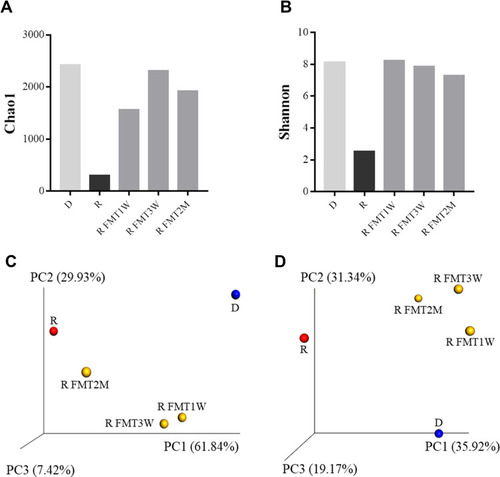
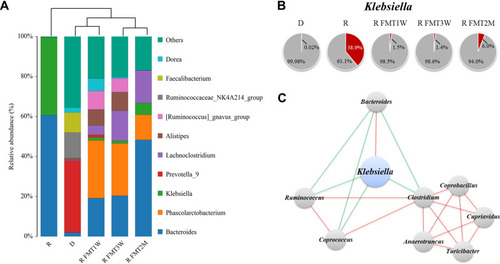
Figure 4 Gut microbial compositions of the donor and the patient pre- and post-FMT. (A) Cumulative histograms representing average distributions of major taxa at genus level. FMT 1W, FMT 3W and FMT 2M represented 1 week, 3 weeks and 2 months after FMT. (B) Pie chart representing the relative abundance of Klebsiella (red). (C) Network diagrams showing the relationship between Klebsiella and other genera. Red indicated positive correlation and blue indicated negative correlation.