Figures & data
Figure 1 Antimicrobial susceptibility profiles of clinical A. baumannii isolates. (A) Resistance rate of all strains to 18 antimicrobials; (B) approximately 65.4% of isolates exhibited MDR (including XDR).
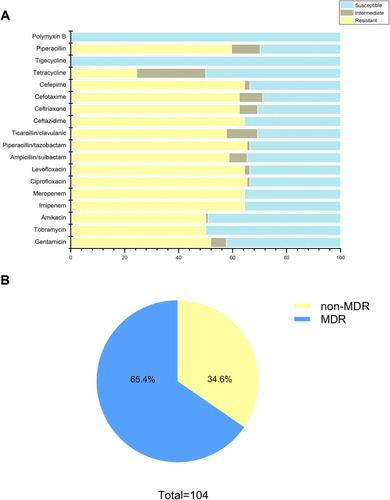
Figure 2 Growth curves and biofilm growth curves in representative A. baumannii strains. (A) Growth curves of 17 representative A. baumannii strains at planktonic stage, and OD590 values of each strain were measured every 2 h until 24 h; (B) growth curves for 17 representative A. baumannii strains at biofilm stage, and OD570 values of each strain were measured every 4 h until 48 h. The data were presented as the average of three measurements. Error bars (standard deviation <10%) were omitted for simplicity.
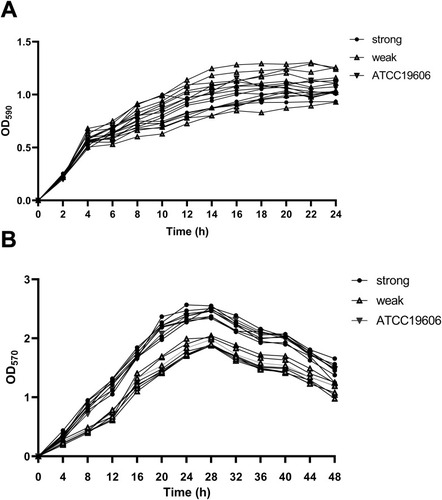
Figure 3 Evaluation of biofilm formation capacity of strains by confocal laser scanning microscopy. (A) Biofilm Images of four representative A. baumannii strains under CLSM (B) Comparison of biofilm formation capabilities between crystal violet and CLSM. Data were expressed as mean ± SD; fluorescence intensity represents CLSM results and OD570 indicates crystal violet results.
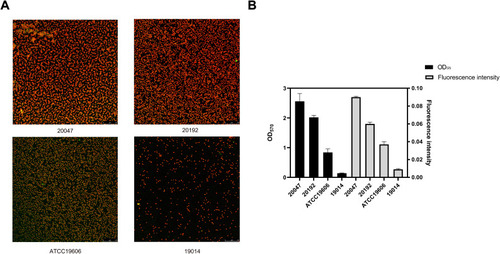
Table 1 Biofilm Formation Ability of Strains with Different Antimicrobial Resistance
Table 2 Correlation Between Biofilm Formation Ability and Antimicrobial Resistance to 18 Antimicrobials
Table 3 Comparison of MICs and MBICs of A. baumannii Strains
Table 4 Comparison of MBCs and MBECs of A. baumannii Strains
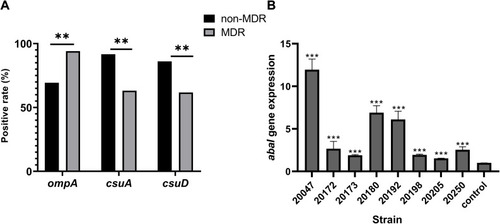
Figure 4 Role of biofilm-associated genes in antimicrobial resistance and biofilm of clinical A. Baumannii. (A) Percentage of biofilm-associated gene in different antimicrobial-resistant strains; (B) the relative expression of abaI in eight selected A. Baumannii strains. Data were shown as fold changes between planktonic and biofilm stage, and control represented planktonic cells.