
Figures & data
Table 1 Baseline Characteristics of Patients Who Received Sofosbuvir-Based Regimens with or without RBV and Diverse Genotypes
Figure 1 Patient disposition and SVR12 rates in various treatment regimens and genotypes. Study flow design. Distribution of patients into the overall cohort and sustained virological response at posttreatment week 12 (SVR12) rates in diverse genotypes and treatment regimens.
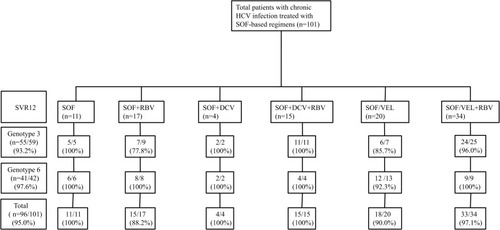
Figure 2 SVR12 rates in patients infected with genotypes 3 and 6 with different characteristics. We analyzed the impact of factors such as sex, age, cirrhotic status, viral load (high level of viral load: serum HCV-RNA> 800,000 IU/mL, low level of viral load: HCV-RNA≤ 800,000 IU/mL), treatment history, HBV coinfection and level of baseline ALT on SVR12 in patients with genotypes 3 and 6 infections. For genotype 3, no significant difference was found between the above factors: p>0.05. Similar results were found in patients infected with genotype 6.
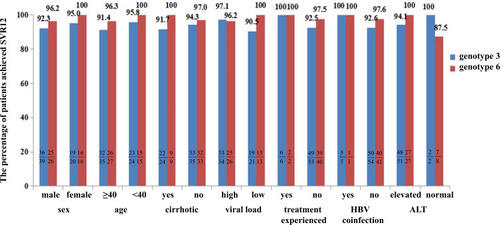
Figure 3 SVR12 rates in patients infected with genotype 3b with different characteristics. We analyzed the impact of factors such as sex, age, cirrhotic status, viral load, treatment history, HBV coinfection and level of baseline ALT on SVR12 in patients with genotype 3b infection. No significant difference was found between the above factors: p>0.05.
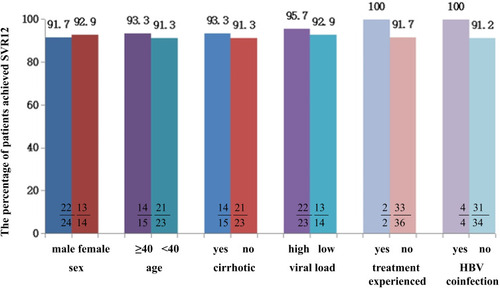
Figure 4 The detailed clinical process in cirrhotic patients with genotype 3b infection.
 -Serum HCV-RNA detectable
  -Time at serum HCV-RNA undetectable to end of treatment.
  -Follow up after end of treatment.
  -Time at occurrence of ALT normalization.
  -Time at occurrence of AFP normalization.
  -Time at occurrence of elevated ALT which was normal before.
  -Patient whose AFP was normal before but elevated during follow-up.
  -Time at detectable serum HCV-RNA which was undetectable before.
  -Patient who achieved SVR12 but detectable serum HCV-RNA during follow-up. Each bar represents a patient. The left side of the figure shows the treatment regimens, the horizontal axis represents the time (week), and week 0 indicates the time at baseline. The number of cirrhotic patients infected with genotype 3b was 15, and one patient treated with SOF/VEL+RBV for 12 weeks was not presented because the time of undetectable HCV-RNA was unclear.
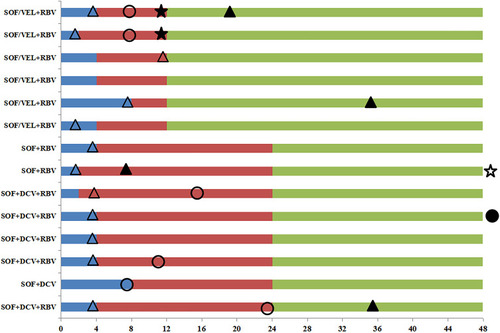
Figure 5 SVR12 rates in patients treated with or without RBV with different characteristics. We compared the SVR12 rates in cirrhotic, noncirrhotic, treatment-experienced (treated with DAAs or interferon and RBV regimens), treatment-naive, high viral load (level of serum HCV-RNA> 800,000 IU/mL), low viral load (HCV-RNA≤ 800,000 IU/mL), and two genotypes. In patients with the above characteristics, no significant difference was found between the groups with RBV and without RBV: p>0.05.
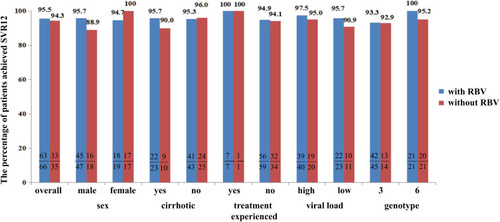
Table 2 Univariate and Multivariate Logistic Analysis of Factors Associated with Fibrosis Improvement
Figure 6 The improvement in fibrosis evaluated by APRI and FIB4. Sub-figure 6A compared the APRI (AST/PLT*100) and Sub-figure 6B compared the FIB-4 ((Age × AST)/(PLT × (square root of ALT)) between pretreatment and posttreatment. The difference in APRI between pretreatment and posttreatment: p<0.0001; a similar result was found in FIB-4.
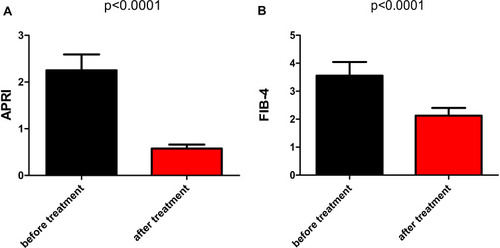
Table 3 The Adverse Events of Patients Who Received SOF-Based Regimens