Figures & data
Table 1 Demographic Analysis
Table 2 Comparison of the Results, Obtained Using NP Swab and Saliva Samples
Figure 1 Correlation between Viral RNA Ct values in matched NP and saliva samples. Only Ct values of the ORF1ab gene were included for NP samples as this gene was detected with all kits and was used for detection in saliva samples as well. “ORF1ab & S” indicates that ORF1ab and S genes were detected in the same channel.
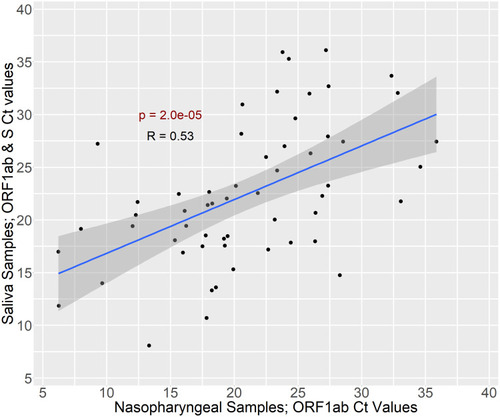
Figure 2 Internal Control RPP RNA Ct values by sample type. The largest group of NP samples that were collected according to the same instructions and matching saliva samples were included.
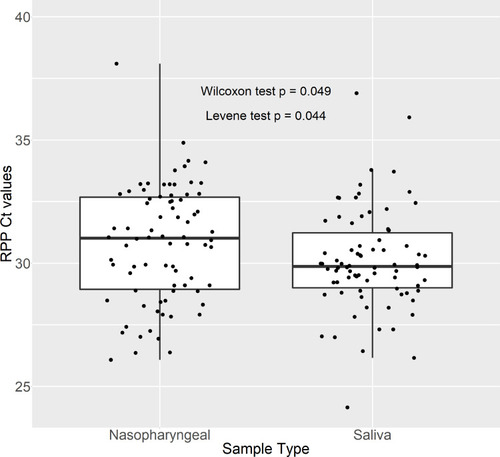
Figure 3 Distribution of Viral Scores in saliva samples. Viral Scores were obtained normalizing Viral RNA Ct values by control RPP RNA Ct values. Viral scores were classified into three groups: low, medium, and high levels. The cutoffs for classification were defined as mean±0.6475*SD and are shown as dotted vertical lines. Dashed vertical line indicates mean of Viral Scores. Separate observations are shown in the rug plot below the density plot.
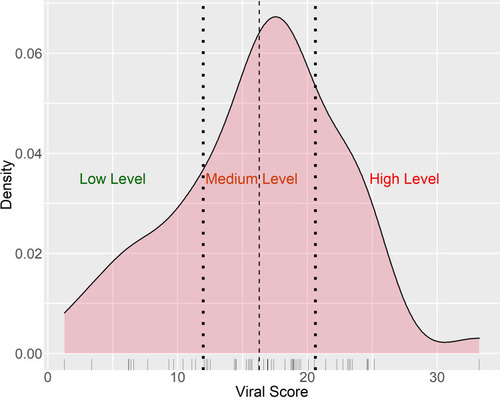
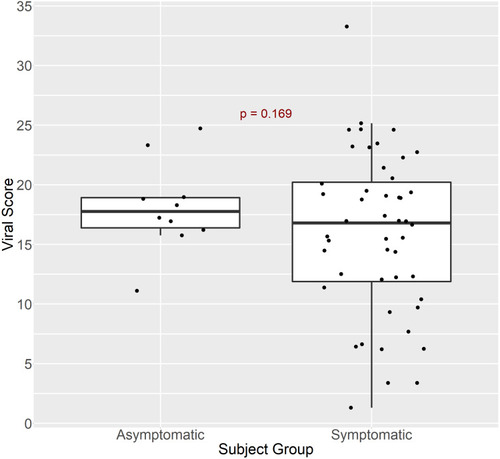
Figure 4 Viral Score values in saliva samples from asymptomatic and symptomatic subjects with the viral infection. P-value of the t-test is provided.