Figures & data
Table 1 Demographics and Clinical Characteristics
Table 2 Microbiological Spectrum of the Ocular Samples
Table 3 Antibiotic Resistance Profiles for Isolates
Table 4 Antibiotic Susceptibility Trends for Staphylococci from 2005 to 2020
Figure 1 Resistance to other antibiotic classes among isolates by methicillin resistance status. (A) Staphylococcus aureus. (B) Coagulase-negative staphylococci.
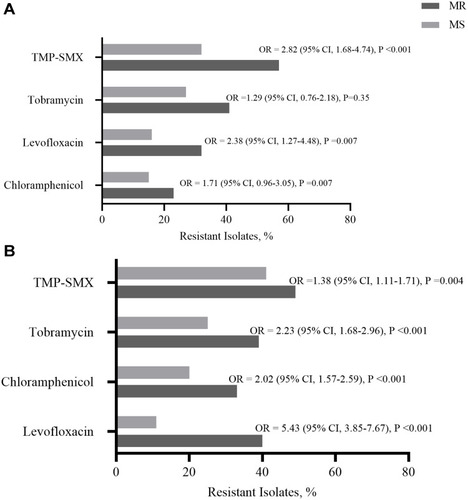
Figure 2 Resistance among ocular isolates by patient age. Data are expressed as mean (SE) percentage of resistance (black line) and percentage of methicillin resistance (blue line) by decade of life. P values are calculated using analysis of variance of the mean percentage of resistance.
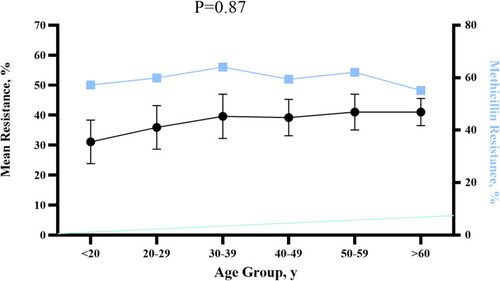
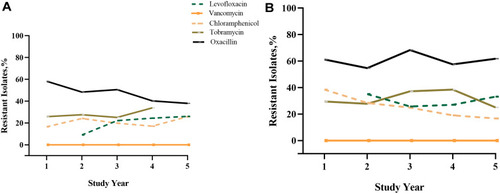
Figure 3 Antibiotic resistance trends over time. (A) Staphylococcus aureus. (B) Coagulase-negative staphylococci.