
Figures & data
Table 1 Demographic Characteristics of 393 MSM-Infected Patients with Virologic Failure in ART
Figure 1 Distribution characteristics of HIV-1 genotypes among MSM with ART failure in Guangdong Province from 2014 to 2019. The maximum likelihood phylogenetic tree was constructed using PhyML 3.0. The reference sequences, including nine subtypes (A–D, F–H, J and K), CRF01_AE, CRF07_BC, CRF08_BC, CRF55_01B, and CRF59_01B, were downloaded from the Los Alamos HIV Sequence Database (https://www.hiv.lanl.gov/content/index). Different colour lines represent different genotypes. The subtype H sequences were selected as the outgroup. aLTR values higher than 0.9 were used to identify lineages and are indicated at the corresponding nodes of the tree.
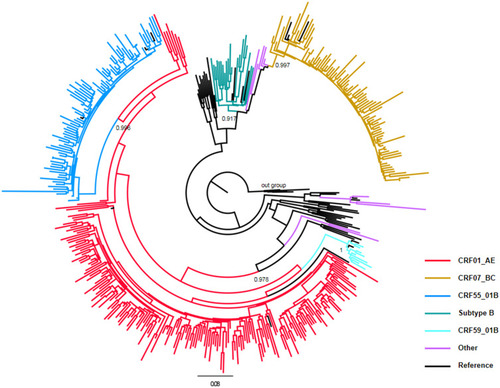
Table 2 General Information Accompanied with Drug Resistance Among 393 MSM Patients with ART Failure
Table 3 The Number and Prevalence (%) of Drug Resistance Mutations Among MSM with ART Failure
Figure 2 Age- and drug-resistance-associated genetic transmission networks of different genotype sequences. The networks were constructed using Cytoscape with a pairwise genetic distance analysed by using HyPhy software. A total of 27 CRF01_AE sequences (A), 33 CRF07_BC sequences (B), 52 CRF55_01B sequences (C), and 3 CRF59_01B sequences (D) were used for genetic transmission network analysis, and the largest cluster had 48 sequences. Different colours and shapes represent sequences from different age groups or those showing drug resistance or not, respectively.
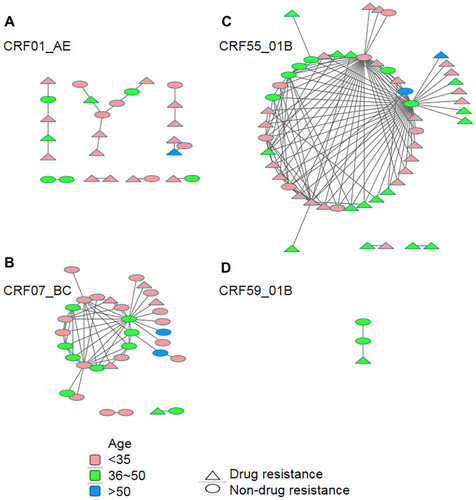
Table 4 Distributions of HIV-1-Infected MSM with ART Failure Within the Three Major Transmission Networks