
Figures & data
Figure 1 Flow chart of the two phases in the study.
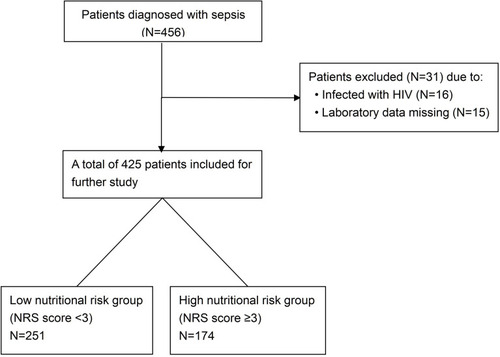
Table 1 Basic Clinical Data of Sepsis Patients in Different NRS Score Groups
Figure 2 BMI and ALB in different nutritional risk screening score subgroups. (A) There were statistically significant differences in BMI among the six subgroups with different NRS scores (23.2±3.9 vs 22.9±3.6 vs 21.5±2.9 vs 19.9±3.8 vs 21.2±3.4 vs 19.1±3.1, P<0.001). (B) There were statistically significant differences in ALB among the six subgroups with different NRS scores (40.3±4.5 vs 38.6±5.6 vs 37.6±5.4 vs 33.4±5.8 vs 31.1±5.5 vs 32.6±5.2, P<0.001).
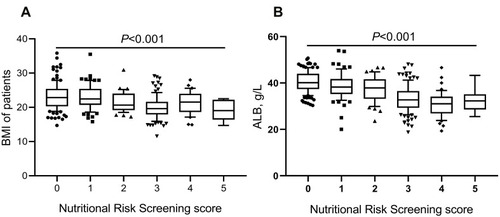
Figure 3 Clinical outcomes in different nutritional risk screening score subgroups. The composition of survivors in hospitalized patients with sepsis was statistically different across the six subgroups with various NRS scores (88.9% vs 84.0% vs 84.6% vs 82.1% vs 67.6% vs 55.6%, P=0.020).
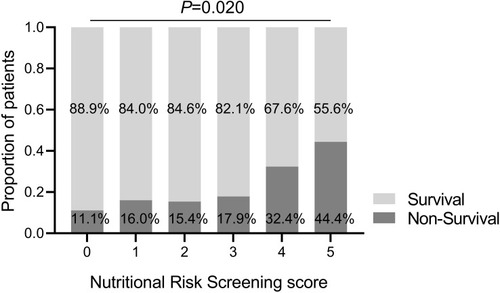
Figure 4 Kaplan–Meier survival estimates of sepsis mortality by nutritional risk screening score groups. Cumulative in-hospital survival was significantly lower in sepsis patients with an NRS score of ≥3 (high nutritional risk group) than in those with an NRS score of <3 (low nutritional risk group) (76.6% vs 86.6%, Log Rank=5.225, P=0.022).
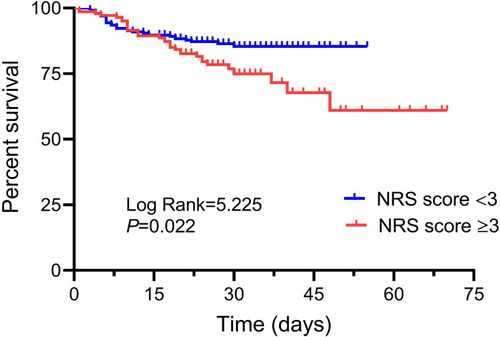
Table 2 Univariate and Multivariate Analysis of Poor Prognosis of Patients with Sepsis