Figures & data
Table 1 Differences in COVID-19 Patients Characteristics Between Hypoalbuminemia and Normal Albumin Group
Table 2 Laboratory Findings in COVID-19 Patients Characteristics Between Hypoalbuminemia and Normal Albumin Group
Table 3 Univariate and Multivariate Analysis of COVID-19 Patients with Hypoalbuminemia
Table 4 Univariate and Multivariate Analysis of COVID-19 Patients with Severity
Table 5 Univariate and Multivariate Analysis of COVID-19 Patients with Abnormal Liver Biochemistries
Table 6 Univariate and Multivariate Analysis of COVID-19 Patients with Death
Table 7 Linear Regression Analysis of Hospital Stays for Patients with COVID-19
Table 8 Linear Regression Analysis of Days Between the Appearance of Hypoalbuminemia and Hospital Admission in Patients with COVID-19 and Hypoalbuminemia
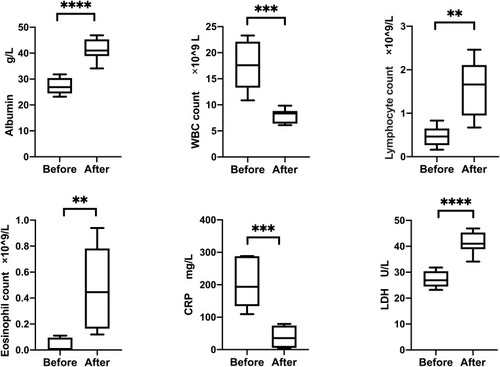
Figure 1 Changes in albumin and other laboratory tests before and after enteral nutrition therapy in 10 patients with COVID-2019 and hypoalbuminemia. Statistical analysis was achieved by the t-test. **P < 0.01, ***P < 0.001 and ****P< 0.0001.