Figures & data
Table 1 Differentially Expressed Genes
Figure 1 Difference analysis and signaling pathway enrichment. (A) Principal component analysis diagram, red dots for extra-pulmonary tuberculosis, blue triangles for healthy control. (B) Heatmap was drawn for the top 25 differentially expressed genes set. (C) Differentially expressed genes set drew a volcanic map, 91 red dots represented up-regulated genes and 10 blue dots represented down-regulated genes. (D) Metascape analyzed of the first 20 significant enrichment pathways of differentially expressed genes set.
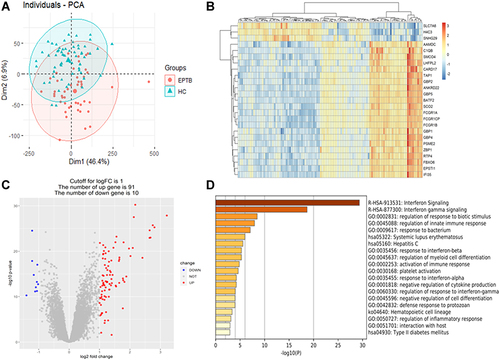
Table 2 GSEA Enrichment Analysis Results
Figure 2 Gene Set Enrichment Analysis enrichment analysis results. (A) GSEA inflammatory signaling pathway. (B) GSEA interferon-gamma signaling pathway. (C) GSEA NF-κB mediated TNFA signaling pathway. (D) GSEA allograft rejection signaling pathway. (E) GSEA complement signaling pathway. (F) GSEA interferon-alpha signaling pathway.
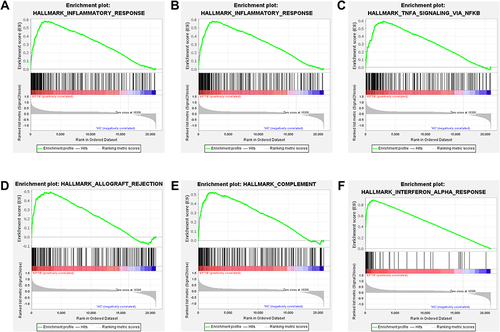
Table 3 MCODE Was Used to Process Data Downloaded from STRING, Specific Data of Gene Cluster
Figure 3 The protein-protein interaction network diagrams of differential genes and key genes were visualized by Cytoscape software. (A) A protein-protein interaction network composed of 66 nodes and 509 edges and 3 main gene clusters. (B) Hub gene related protein-protein interaction network diagram.
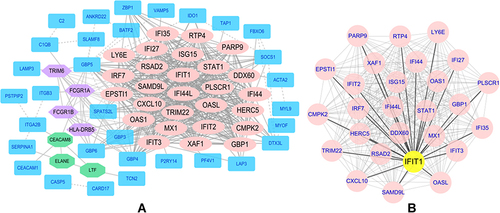
Table 4 Tissue-Specific Expressed Genes Identified by BioGPS
Table 5 Clinical Data of CNS-TB Patients
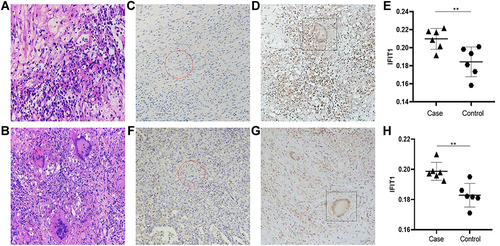
Figure 4 Hematoxylin and Eosin staining and IFIT1 typical IHC staining results and analysis. (A and B) Central nervous system tuberculosis hematoxylin and eosin (H&E) staining of lesion tissue and control tissue. (C–E) Central nervous system tuberculosis IFIT1 typical Immunohistochemistry staining. (F–H) Tuberculosis IFIT1 typical Immunohistochemistry staining. **p<0.05, The difference was statistically significant.