
Figures & data
Figure 1 An overview workflow of the comprehensive analysis of metabolomics and transcriptomics in tuberculosis.
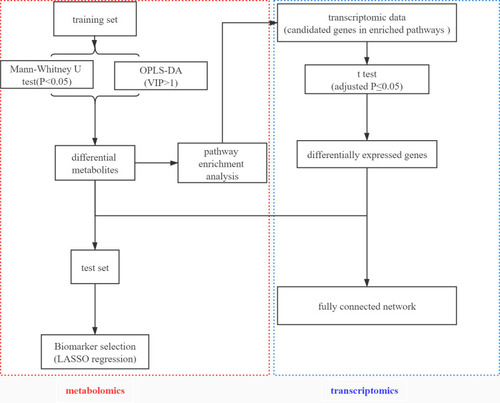
Table 1 Characteristics (n = 90) for TB Cases, LTBI and HC Subjects*
Figure 2 Multivariate statistical analyses of the different clinical groups in the study. (A) Principal component analysis (PCA) score plots of the TB patients (TB, red), latently infected tuberculosis (LTBI, green) and healthy controls (HC, blue) serum samples. Orthogonal partial least squares-discriminate analysis (OPLS-DA) score plots for the comparison between (B) HC (blue) and LTBI (green) (R2Y= 0.937, Q2= 0.135), (C) TB (red) and HC (blue) (R2Y= 0.895, Q2= 0.709) and (D) TB (red) and LTBI (green) (R2Y= 0.952, Q2= 0.776).
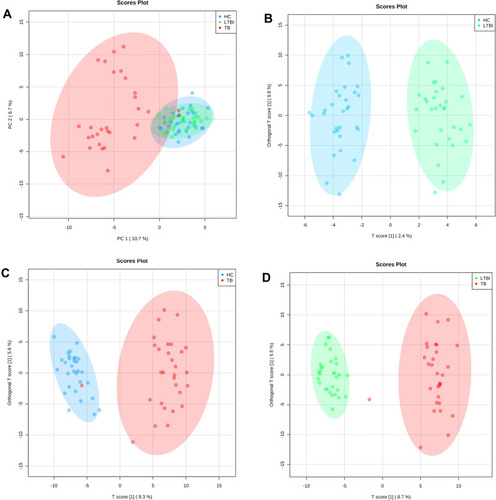
Figure 3 Volcanic map of differential metabolites. For the LTBI/HC group (A) and LTBI/TB (B) and TB/HC group (C). The abscissa represented the fold change of the group compared to each substance (take the base 2 logarithm), the ordinate represented the P-value (take the base 10 logarithm), and the scatter size represented the VIP value of the OPLS-DA model. The larger the scattering, the larger the VIP value. The scatter color represented the final screening result. Significantly up-regulated metabolites are shown in red (FC ≥1, P < 0.05), significantly down-regulated metabolites are shown in blue (FC ≤-1, P < 0.05), and non-significant differential metabolites are shown in gray. (D) The Venn diagrams show the overlap between different health statuses for metabolites with significant abundance differences (VIP ≥1 and P < 0.05) between LTBI/HC group, LTBI/TB, and TB/HC group.
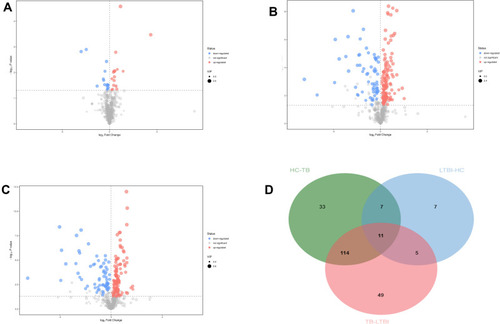
Table 2 Coefficient and Cut-off Using Metabolites Biomarkers Distinguishing Between TB and HC Subjects
Figure 4 Receiver operating characteristic model of the single metabolites included in the LASSO regression equation. The ROC curves of each metabolite showed a moderate distinguishing efficiency in TB vs HC group.
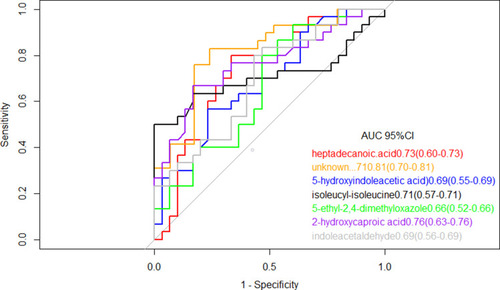
Figure 5 Metabolite set enrichment analysis (MSEA) of differentiating metabolites from TB patients and HC subjects. The scatter shows the most altered metabolic pathways with fold enrichment higher than 1 (increasing P-value coloured from red to white).
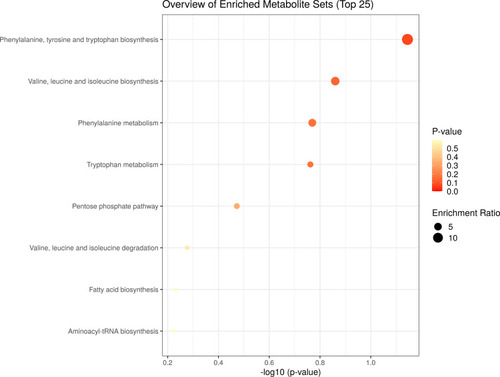
Table 3 Nine Genes Enriched in 3 Pathways