Figures & data
Table 1 Baseline Demographics of the Study Population
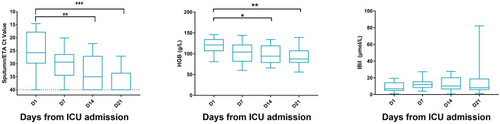
Figure 1 Dynamics of SARS-CoV-2 virus load and indices for hemolytic anemia during ribavirin treatment. The dynamic change of SARS-CoV-2 virus PCR’s Ct values of 19 patients from sputum/ETA. HGB (hemoglobin), and IBil (indirect bilirubin) for Ribavirin-related hemolytic anemia were shown in four different time points (day 1, day 7, day 14 and day 21 from ICU admission/starting Ribavirin treatment). *p<0.05 **p<0.01 ***p< 0.001.