Figures & data
Table 1 Determination of Minimum Inhibitory Concentration (MIC) for K. variicola SKv2E and K. pneumoniae SKp2F and Their blaKPC Transconjugants
Table 2 Genome Characteristics of K. variicola SKv2E and K. pneumoniae SKp2F
Figure 1 Schematic mapping of the genetic characteristics of the resistance gene (blaKPC-2)-carrying region in strain K. variicola SKv2E and K. pneumoniae SKp2F. The construction of the sequence comparison was performed using blast (http://blast.ncbi.nlm.nih.gov). Genes are shown as arrows, and their orientations of transcription are indicated by the arrowheads.
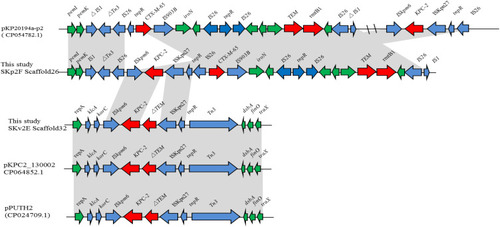
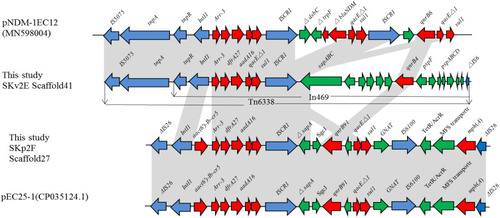
Figure 2 Schematic mapping of the genetic characteristics of resistance gene (arr-3, dfrA27, aadA16, qnrB)-carrying region in strain K. variicola SKv2E and K. pneumoniae SKp2F. The construction of the sequence comparison was performed using blast (http://blast.ncbi.nlm.nih.gov). Genes are shown as arrows, and their orientations of transcription are indicated by the arrowheads.