
Figures & data
Figure 1 Continue.
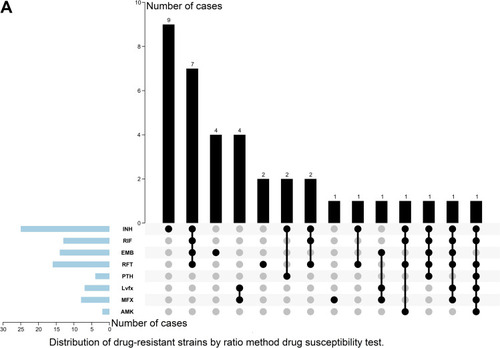
Figure 1 Distribution of 37 drug-resistant Mycobacterium tuberculosis isolates. (A) Distribution of drug-resistant strains by ratio method drug susceptibility test. (B) Distribution of drug-resistant strains by Whole-genome sequencing. (C) Distribution of drug-resistant types by the ratio method drug susceptibility test.
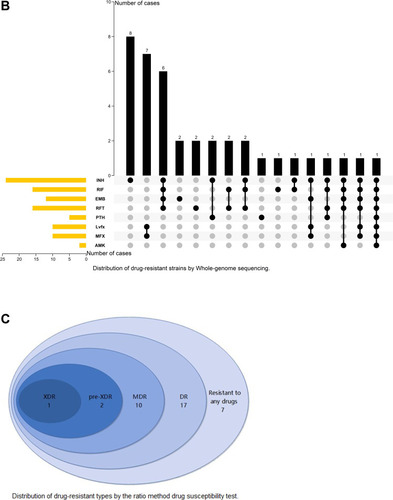
Table 1 Distribution of Mutation Sites in Drug Resistant Isolates and Drug Sensitivity Strains
Table 2 Genotype Distributions in Different Groups (n, %)
Table 3 Whole Genome Sequencing Compared with Phenotypic Drug Sensitivity Test in Drug Resistance Diagnosis of Mycobacterium tuberculosis Isolates
Table 4 Population Characteristics and Clinical Data of 208 Pediatric Tuberculosis Patients (n, %)
Table 5 The Distribution of Population Characteristics and Clinical Materials in Lineage 2 and Lineage 4 Groups (n, %)
Table 6 The Distribution of Clinical Materials in Severe and Non-Severe Patients (n, %)
Table 7 Factors Associated with Different Diagnosis of Tuberculosis in Children