
Figures & data
Figure 1 Constituent ratio of different age groups of HPV infection.
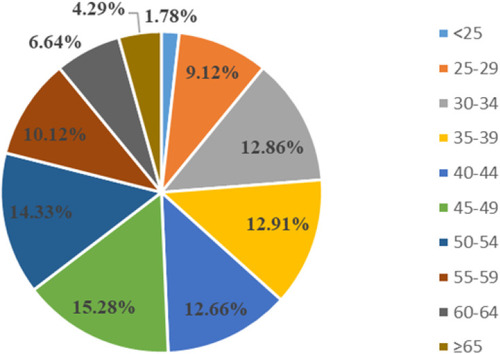
Figure 2 Distribution of HPV genotypes among healthy women.
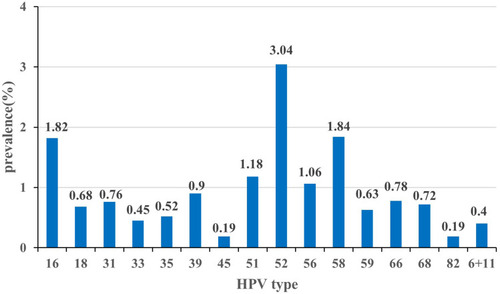
Table 1 Frequency and Prevalence of Single and Multiple HPV Infection Among Healthy Women
Table 2 The Top Ten Combinations of Genotypes in HPV Double Infections
Figure 3 Prevalence of HPV grouped by age. (A) Prevalence of HPV infection in different age groups; (B) Prevalence of single and multiple infection of HPV in different age groups; (C) Prevalence of HPV16, 51, 52, 56, and 58 in different age groups.
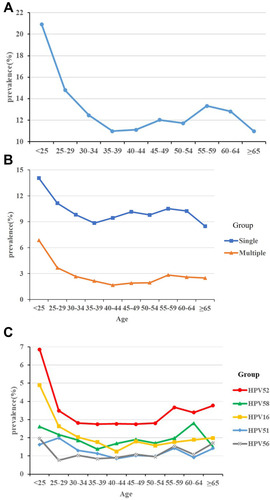
Table 3 Comparison of Annual Total, Single, and Multiple Infection Rates of HPV from 2016 to 2019
Table 4 Comparison the Prevalence of Different HPV Subtypes from 2016 to 2019
Table 5 Comparison of HPV Infection Rate of Different Ages from 2016 to 2019
Table 6 Comparison of HPV Infection Rates in Different Areas in China
Table 7 Prevalence of the Three Most Common HPV Genotypes of in Different Areas in China