
Figures & data
Table 1 Incidence of Acute POE Among Different Years and Hospitals
Figure 1 The trends of the incidence of acute POE (postoperative endophthalmitis) over years among different hospitals. The black arrow: time point when 5% PVP-I (povidone-iodine) started to be used in Hospital-A. The gray arrow: time point when 0.5% PVP-I started to be used in Hospital-F. “※” represents the p value for comparing the incidences of POE before and after the usage of PVP-I was less than 0.05, which suggests the incidence of postoperative endophthalmitis significantly decreased in Hospital-F after the application of 0.5% PVP-I.
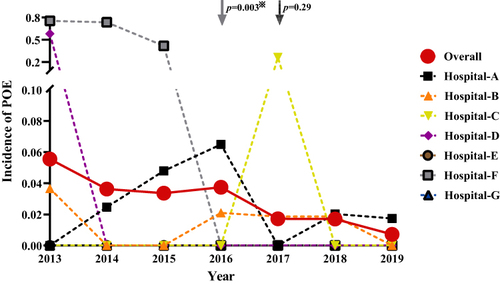
Table 2 Perioperative Infection Prophylaxis in Each of Hospitals
Table 3 Analysis of Potential Prognostic Factors for Final Visual Outcome in POE Patients