
Figures & data
Table 1 Demographic Data and Clinical Characteristics of the Study Subjects at the Beginning of Antiretroviral Therapy (n=6637)
Table 2 Logistic Regression Analysis to Identify Factors Associated with Thrombocytopenia or Thrombocytosis in ART-Naïve Patients
Figure 1 Recovery rate of thrombocyte abnormalities at different treatment duration. Recovery rate of thrombocytopenia and thrombocytosis after 12, 24, 36, and 48 months of antiretroviral therapy (blue: thrombocytopenia; red: thrombocytosis).
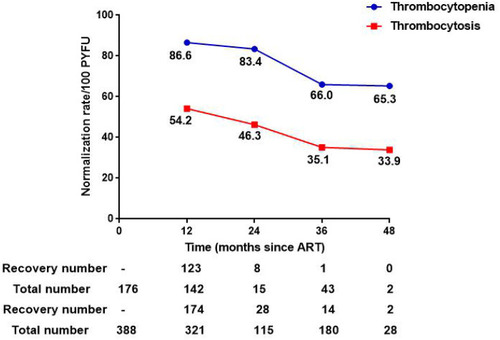
Figure 2 Incidence of new-onset thrombocyte abnormalities at different treatment duration. (A) Rate of new-onset thrombocytopenia after 12, 24, 36, 48, 60, 72, and 84 months of antiretroviral therapy. (B) Rate of new-onset thrombocytosis after 12, 24, 36, 48, 60, 72, and 84 months of antiretroviral therapy.
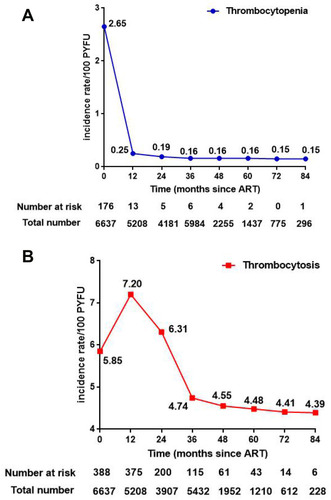
Figure 3 The proportion of different antiretroviral treatment regimens among HIV-infected patients. (A) The proportion of different antiretroviral treatment regimens among total subjects (n=5195). (B) The proportion of different antiretroviral treatment regimens in subjects with thrombocytosis (n=375).
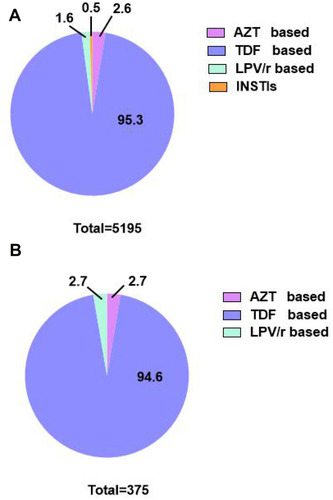
Table 3 The Ratio of Thrombocytosis in Each Regimen After 12 Months of Therapy
Table 4 Cox Proportional Hazard Regression Analysis to Identify Risk Factors Related to Thrombocytosis After 12 Months of Treatment