Figures & data
Table 1 Characteristics of the Study Cohort
Figure 1 Flowchart of the study population.
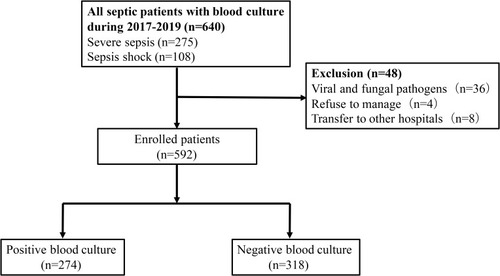
Figure 2 The primary infection sites of culture-positive and culture-negative groups. *P<0.05, **P<0.01.
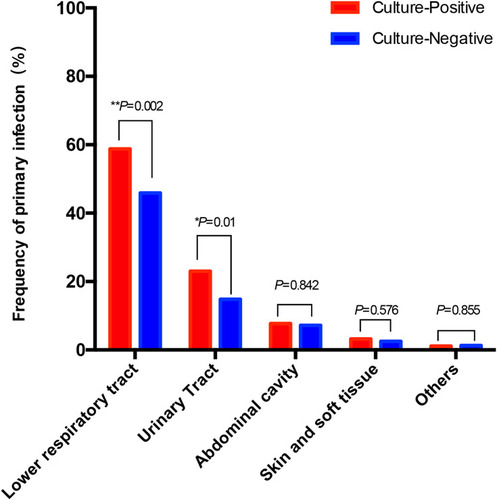
Table 2 Comparison of Laboratory Characteristic and Severity Between Culture Positive and Culture Negative Patients
Table 3 Frequency of Bacteria for the Positive Blood Culture Sepsis in the Throughout Hospital
Table 4 Frequency of Bacteria for the Positive Blood Culture Sepsis in the ICU
Table 5 Frequency of Bacteria for the Positive Blood Culture Sepsis in the ED
Figure 3 The distribution and total mortality of all kinds of bacteria in the throughout hospital among culture-positive bacteria. (A) The distribution of all kinds of bacteria in the throughout hospital among culture-positive bacteria. (B) The total mortality of all kinds of bacteria in the throughout hospital among culture-positive bacteria.
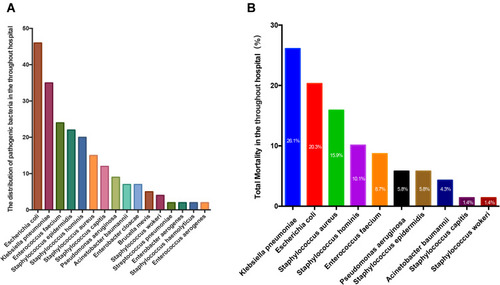
Figure 4 The distribution and total mortality of all kinds of bacteria in the ICU among culture-positive bacteria. (A) The distribution of all kinds of bacteria in the ICU among culture-positive bacteria. (B) The total mortality of all kinds of bacteria in the ICU among culture-positive bacteria.
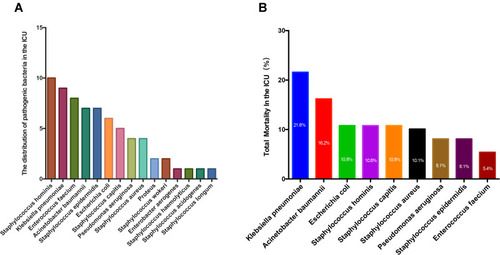
Figure 5 The distribution and total mortality of all kinds of bacteria in the ED among culture-positive bacteria. (A) The distribution of all kinds of bacteria in the ED among culture-positive bacteria. (B) The total mortality of all kinds of bacteria in the ED among culture-positive bacteria.
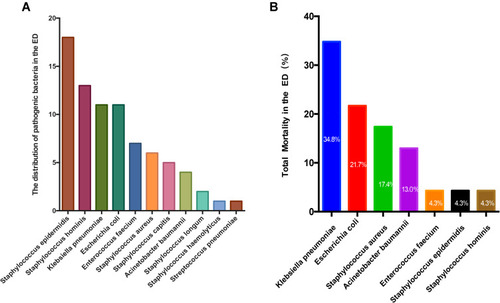
Table 6 Comparison of Outcomes Between Positive and Negative Blood Culture Sepsis
Figure 6 The mortality of ICU, in-hospital, early day (28-day) and late day (28–90-day) between culture-positive and culture-negative groups. *P<0.05, **P<0.01.
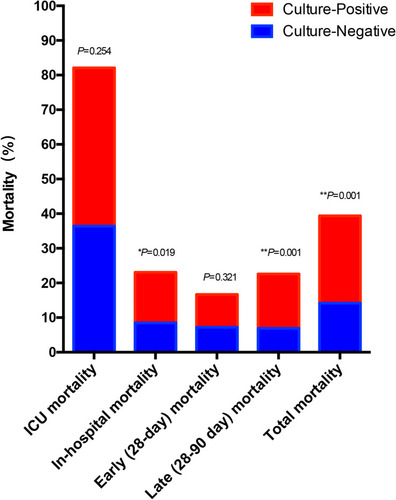
Figure 7 The Kaplan-Meier survival curve facilitated visual comparison between culture-positive and culture-negative septic patients. The results showed that the two groups had comparable early mortality but worse late mortality (Log-rank P value=0.001). *P<0.05.
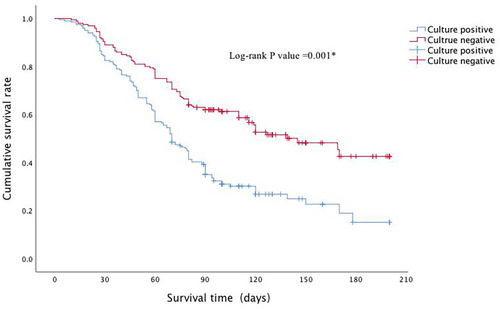
Figure 8 Odds ratio for culture-positive group and culture-negative group. (A) Odds ratio for culture-positive group. (B) Odds ratio for culture- negative group.
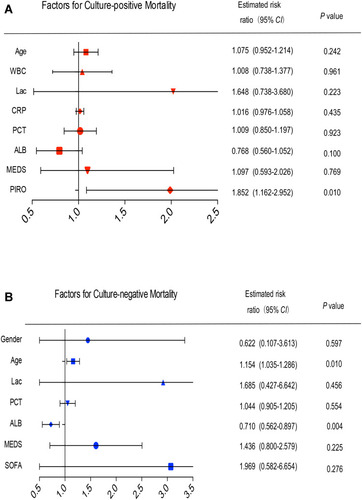
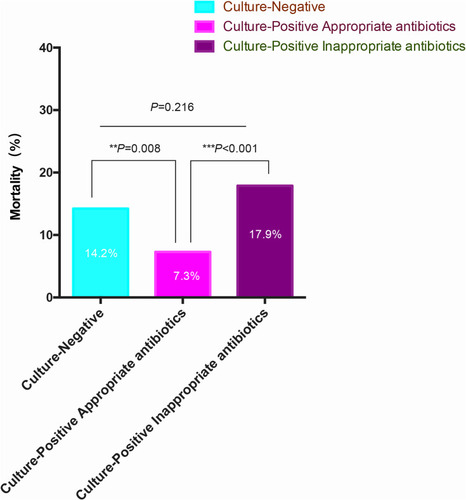
Figure 9 The clinical outcomes and mortality of culture-positive patients after receiving appropriate antibiotic. **P<0.01, ***P<0.001.