
Figures & data
Figure 1 The distribution of people living with HIV/AIDS recruited in this study.
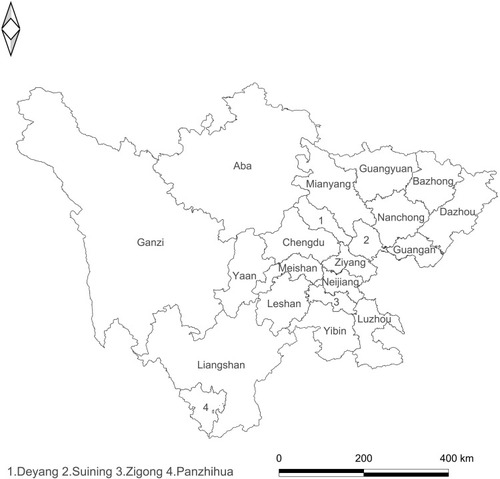
Figure 2 Resistance-drug transmission sketch map.
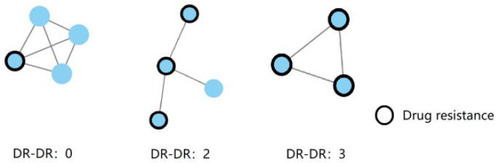
Figure 3 Continued.
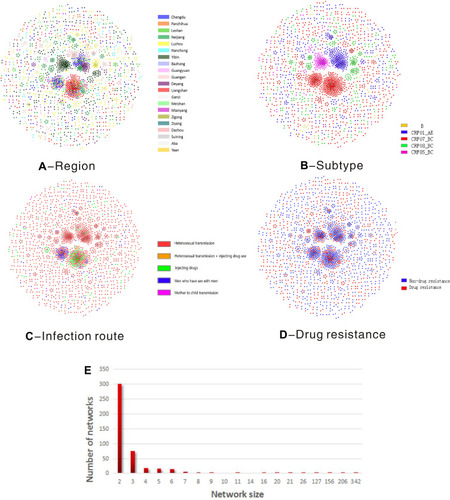
Figure 3 HIV-1 transmission clusters. (A) Region-associated transmission clusters. Different colors represent different cities. (B) Genetic subtype-associated transmission networks. Different colors represent different subtypes: Orange: B subtype; blue: CRF_01AE; red: CRF_07BC; green: CRF_08BC; pink: CRF_85BC. (C) Infection route and region-associated transmission clusters. Different colors represent different infection routes: red: heterosexual transmission (Hetero); Orange: sexual transmission and injection drug users (IDUs); green: IDUs; blue: men who have sex with men (MSM); pink: mother to child transmission. (D) Drug resistance associated genetic transmission networks. Blue: CRF_01AE; red: CRF_07BC (E) Size of HIV-1 transmission clusters among the PLWH, size represents the number of individuals in a cluster. (F) Distribution of HIV-1 transmission degree. The node represents individuals in the network; degree represents the number of edges that link one node to other nodes.

Table 1 Urban Distribution of the Individuals Clustering of DR
Table 2 Risk Factors of Drug Resistant Nodes with Drug Resistance-Associated Transmission Links ≥2
Figure 4 The geographic dimension of HIV-1 Drug-resistance transmission. (A) HIV-1 transmission in Sichuan. (B) HIV-1 Drug Resistance transmission with virological failure of ART in Sichuan. Circles with different size represents the number of individuals with drug resistance-associated transmission links within the region; the lines with different colors represent the number of individuals with drug resistance-associated transmission links between regions.
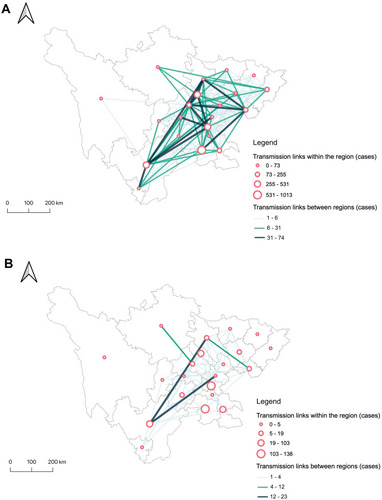
Table 3 Links of HIV DRMs with Subtype in Transmission Network