Figures & data
Table 1 General and Laboratory Data of Studied Neonates
Figure 1 Microorganism results of blood culture in the septic group.
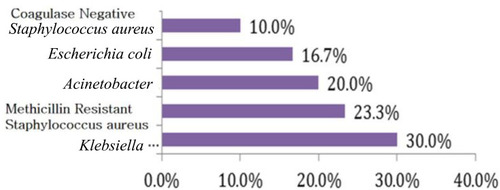
Table 2 Percentage of Monocyte Subset and CD86 Positive Monocytes and Serum Levels of Procalcitonin and IL-17 in the Studied Groups
Table 3 Cutoff Values, Sensitivities, and Specificities for Serum IL-17 and Procalcitonin Level, Percentage of CD86 Positive Monocytes, CD16 MFI on CD16 Positive Monocytes and CRP in Early Detection of Early Neonatal Sepsis
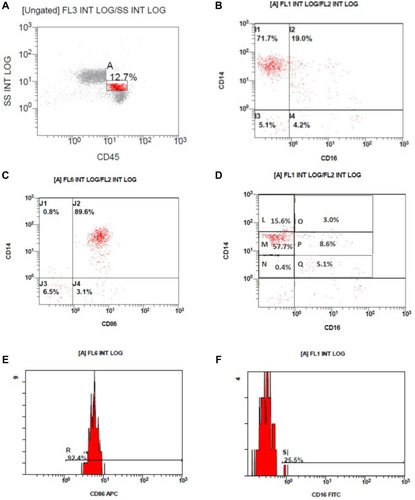
Figure 2 Flow cytometric results. (A) Monocyte gating on the CD45/side scatter, (B) CD14/CD16 expression on the gated monocytes. (C) CD14/CD16 expression on the gated monocytes. (D) Monocyte subclasses; CD14++/CD16– classical monocytes (L) and (M), CD14++/CD16+ intermediate monocytes (O) and (P) and CD14+/CD16+ nonclassical monocytes (Q). (E) Histogram of CD86 expression on monocytes. (F) Histogram of CD16 expression on monocytes.