
Figures & data
Table 1 The Proportions of the Isolates with Different MICs of Ertapenem by Provinces
Figure 1 The percentage of N. gonorrhoeae isolates with different MICs (mg/L) for ertapenem. The MIC50 (yellow-dotted line), MIC90 (red-dotted line) and number of isolates per province are shown.
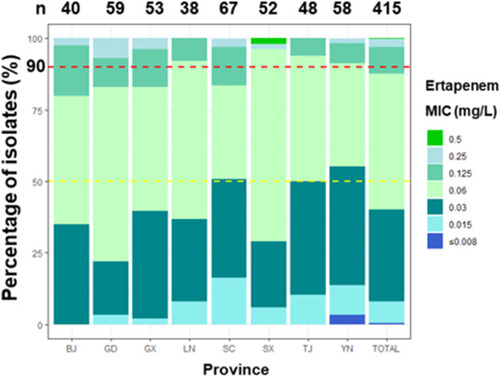
Figure 2 Correlation between MICs of ertapenem and ceftriaxone or azithromycin. Each symbol represents one or multiple isolates, which is also shown with specific numbers and colors. The regression line was calculated using log2-transformed MIC data. For the MICs ≤ or ≥ a specific value, log2-transformed this specific value was used for calculating linear regression. (A) Correlation between MICs of ertapenem and ceftriaxone, r = 0.487, P <0.001. (B) Correlation between MICs of ertapenem and azithromycin, r = −0.12, P = 0.007.
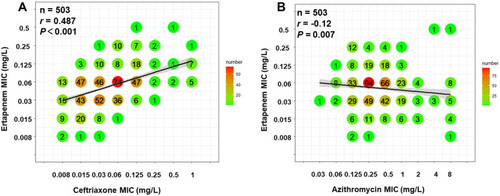
Table 2 Ertapenem MICs Distributions for Decreased Susceptibility to Ceftriaxone (DSC) or Azithromycin-Resistant (RTA) N. gonorrhoeae Isolates