Figures & data
Table 1 Diagnosis and Treatment Enrollment Cascade for MDR/RR-TB in Shenzhen, 2012–2020 [n (%)]
Figure 1 Study flow diagram.
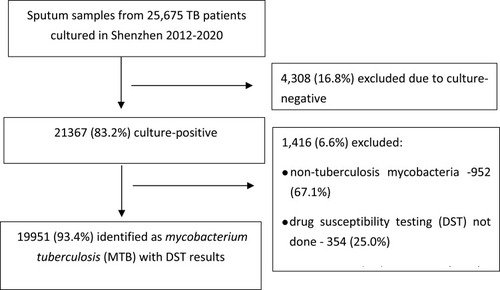
Table 2 Drug Resistance Patterns of 19,951 MTB Cases Stratified by Residential Status [n (%)]
Table 3 RR-TB and MDR-TB Rates Among 19,951 MTB Patients in Shenzhen, 2012–2020
Table 4 Multivariate Analysis on Predictors of MDR-TB and RR-TB
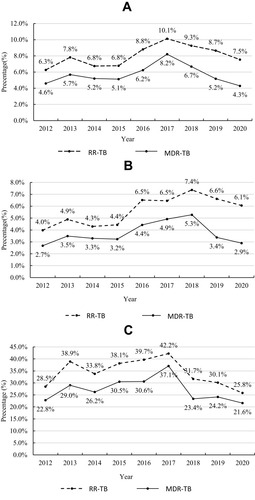
Figure 2 Trends in RR-TB and MDR-TB in Shenzhen during the 2012–2020 period.
Notes: MDR-TB refers to TB resistant to at least INH and RMP, while RR-TB refers to TB resistant to at least RMP and includes MDR-TB; therefore, RR-TB is grouped together with MDR-TB as MDR/RR-TB. (A) The overall proportion of MDR-TB increased during the 2012–2017 period (Ptrend =0.02) and decreased during the 2017–2020 period (Ptrend =0.01). The proportion of MDR/RR-TB also increased during the 2012–2017 period (Ptrend =0.045) and decreased during the 2017–2020 period (Ptrend =0.26). (B) In new cases, the proportion of MDR-TB increased during the 2012–2018 period (Ptrend =0.01) and decreased during the 2018–2020 period (Ptrend =0.04). The proportion of MDR/RR-TB also increased during the 2012–2018 period (Ptrend =0.02) and decreased during the 2018–2020 period (Ptrend =0.50). (C) In previously treated cases, the proportion of MDR-TB increased during the 2012–2017 period (Ptrend =0.06) and decreased during the 2017–2020 period (Ptrend =0.03). The proportion of MDR/RR-TB increased during the 2012–2017 period (Ptrend =0.22) and decreased during the 2017–2020 period (Ptrend =0.07).