Figures & data
Table 1 Baseline Characteristics of Patients Enrolled in This Study
Figure 1 Identification of serum proteins in HBV patients infected with genotype B and those infected genotype C. (A) The number of identified peptides in 3 repeated experiments. (B) The number of identified protein groups in 3 repeated experiments. (C)The Venn diagrams show the numbers of identified proteins and the overlaps of protein identification in the 3 groups.
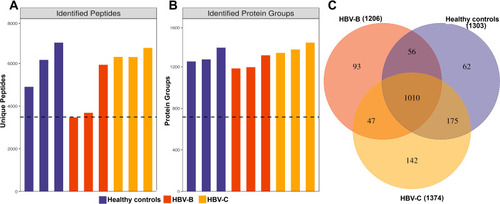
Table 2 List of the Typically Differentially Expressed Proteins Between the Serum Samples from HBV Patients Infected with Genotype B and Those Infected Genotype C
Figure 2 Bioinformatics analysis of differentially expressed proteins between the serum samples of the healthy controls and those of HBV-genotype B infected patients. (A) Volcano plot representing the protein abundance changes (groups B vs A). A total of 53 dysregulated proteins with fold change ≥±1.5 and p-values < 0.05 were identified. (B) Hierarchical clustering of the 53 dysregulated proteins (groups B vs A). (C) GO analysis of 53 dysregulated proteins (groups B vs A). The abscissa represents enriched GO function classifications, which were divided into three major categories: biological process (BP), molecular function (MF) and cellular component (CC). (D) KOG analysis of 53 dysregulated proteins (groups B vs A).
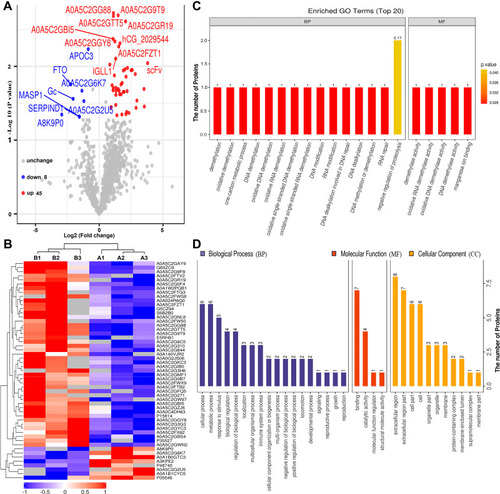
Figure 3 Bioinformatics analysis of differentially expressed proteins between the serum samples of the healthy controls and those of HBV-genotype C infected patients. (A) Volcano plot representing the protein abundance changes (groups C vs A). A total of 59 dysregulated proteins with fold change ≥±1.5 and p-values < 0.05 were identified. (B) Hierarchical clustering of the 66 dysregulated proteins (groups C vs A). (C) GO analysis of 59 dysregulated proteins (groups C vs A). The abscissa represents enriched GO function classifications, which were divided into three major categories: biological process (BP), molecular function (MF) and cellular component (CC). (D) KOG analysis of 59 dysregulated proteins (groups C vs A).
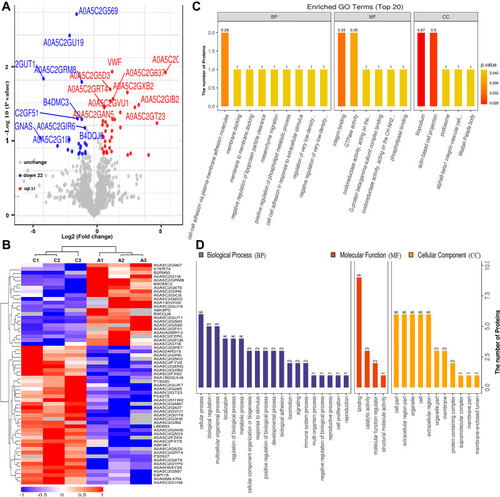
Figure 4 KEGG annotation of the dysregulated proteins from groups of healthy control individuals and HBV-B (A) and groups of healthy control individuals and HBV-C (B).
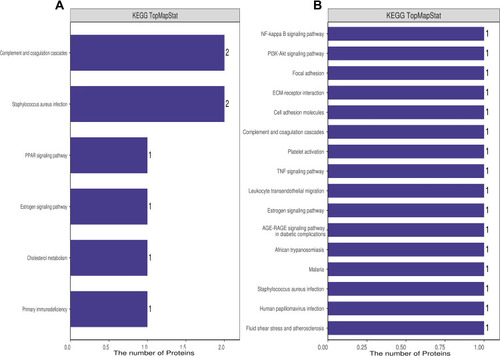
Figure 5 Key signaling pathways involved in the serum samples from HBV patients infected with genotype B and those infected genotype C. ECM–receptor interaction (A) and complement and coagulation cascades (B) obtained from KEGG pathway-based enrichment analysis of dysregulated proteins.
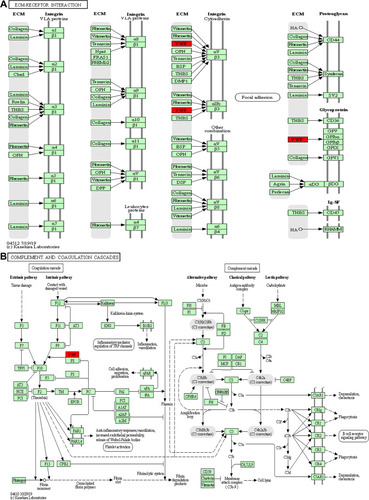
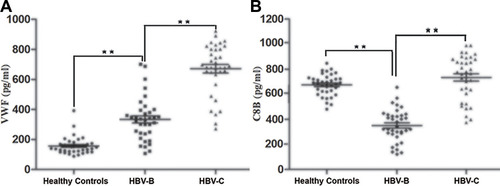
Figure 6 Validation of the selected differentially expressed proteins of VWF (A) and C8B (B) in the serum samples from HBV patients infected with genotype B and those infected genotype C by ELISA in the validation cohort. Data are expressed as the mean SEM (n = 36, *P < 0.05, **P < 0.01).