Figures & data
Figure 1 The statistics on the COVID-19 pandemic for every country in the world from Our World in Data. (A) The cumulative confirmed COVID-19 cases in the world. (B) The cumulative confirmed COVID-19 deaths in the world. (C) The number of fully vaccinated individuals against COVID-19 (total number of people who have received all doses based on vaccination protocol). (D) Share of the fully vaccinated population against COVID-19.
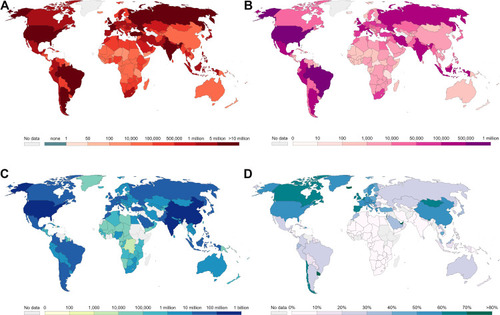
Figure 2 Bibliometric analysis of the COVID-19 publication. (A) Time trends summary. (B) Study type composition summary.
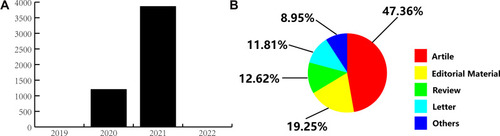
Table 1 The Top Ten Most Active Countries, Organizations and Authors
Figure 3 Bibliometric analysis of co-authorship. (A) Country. (B) Institution. (C) Author.
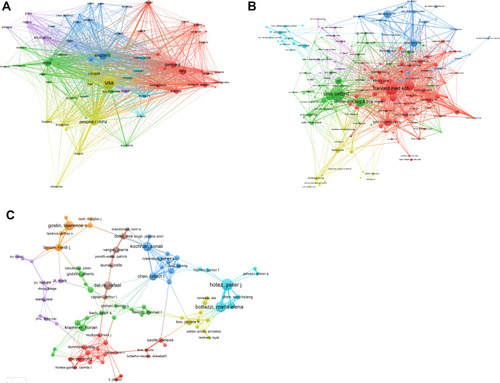
Figure 4 Bibliometric analysis of keywords. (A) Cluster analysis. (B) Timing analysis.
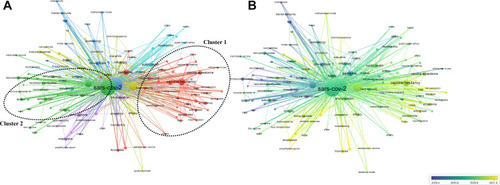
Figure 5 Bibliometric analysis of citations. (A and B) Countries. (C and D) Organizations. (E and F) Authors. (G and H) Journals. (B, D, F, and H) The top 10 most cited countries, institutions, authors, and journals, respectively.
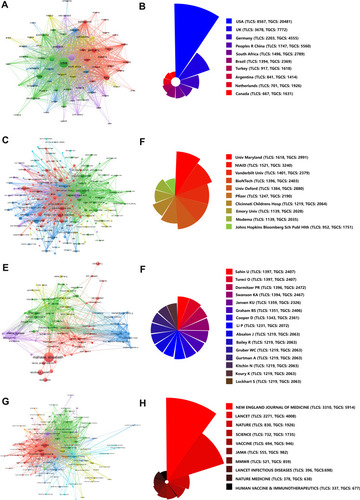
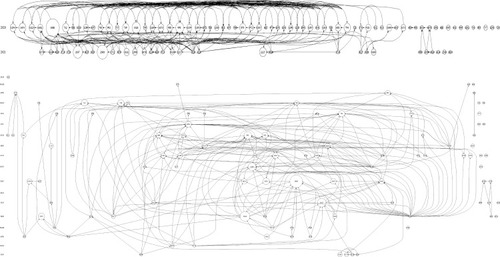
Figure 6 The citation historiography graph based on the studies with the top 100 TLCS.