Figures & data
Figure 1 The decomposed seasonal factors for the TB morbidity series based on the multiplicative decomposition technique. The graph above shows that there is a predominant peak in March–April and a trough in January–February per year.
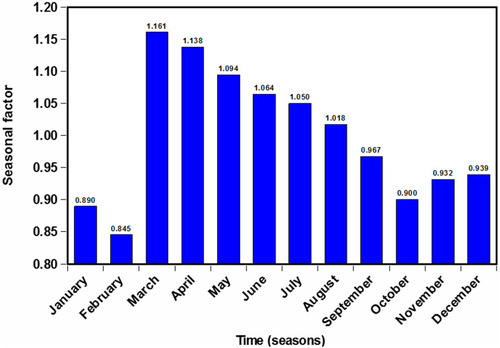
Table 1 Estimated Causal Impact of the COVID-19 Outbreak on the Decrease in the Monthly Average and Cumulative Notifications of TB Cases from January to December 2020
Figure 2 Investigation of the trend, seasonality, and regression components to the TB incidence. (A) Contribution of trend pattern. (B) Contribution of seasonal pattern. (C) Contribution of regression component. As seen, the TB incidence shows an obvious seasonal pattern and the COVID-19 outbreak leads to a notable reduction in the TB cases.
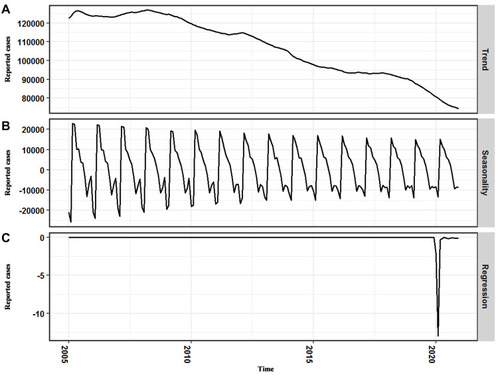
Figure 3 Time series plot displaying the estimated causal effects of the COVID-19 outbreak on the reductions in the TB case notifications from January to December 2020. The first panel displays the TB case notifications and counterfactual forecasted results for the post-outbreak period. The second panel describes the pointwise causal effect that suggests the difference between actual values and forecasted values. The third panel shows a cumulative effect of the COVID-19 outbreak via adding up the pointwise contributions from the second panel.
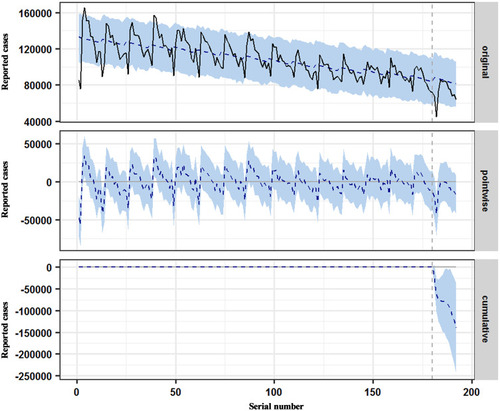
Table 2 The Identified Best Possible ARIMA Models and Their Corresponding Information Criteria Based on Different Datasets
Table 3 Measures of Predicted Performance for BSTS Methods and ARIMA Methods
Figure 4 Time series plot illustrating the comparisons of the predictive TB incidence results between ARIMA models and BSTS models. (A) Comparisons of 12 holdout periods between ARIMA models and BSTS models. (B) Comparisons of 36 holdout periods between the two models. (C) Comparisons of 60 holdout periods between the two models. (D) Comparisons of 96 holdout periods between the two models. It is apparent that the forecasts under the BSTS models are closer to the actual TB epidemics compared to that under the ARIMA models. Importantly, since the 60-step ahead forecasts, the forecasts under the ARIMA models have deviated from the TB epidemic trajectories; whereas the forecasts under the BSTS models still agree pretty well with the actual trends, suggesting that the BSTS approach provides an adequate predictive model for TB epidemics.
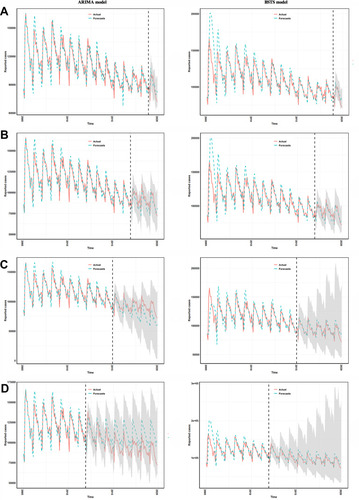
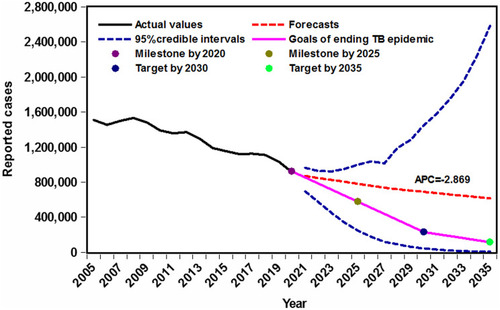
Figure 5 Projections of the TB incidence into 2035 based on the BSTS models. Visible in this figure, although the TB incidence continues to be falling between 2021 and 2035 (APC=−2.869, 95% CI −3.056 to −2.681), it seems to pose a major challenge ahead to reach the WHO’s targets ending the TB epidemics.