
Figures & data
Table 1 Demographic and Clinical Characteristics in the Cases and Controls
Figure 1 Continued.
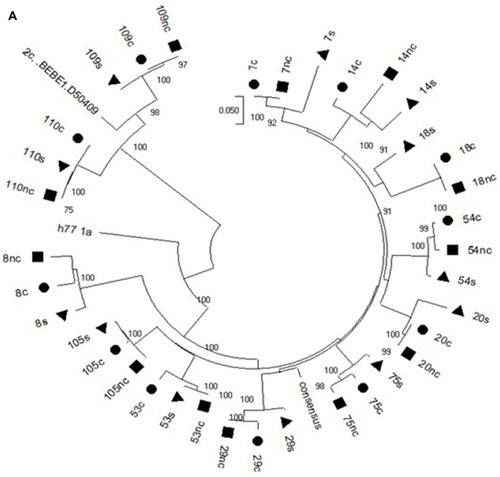
Figure 1 Continued.
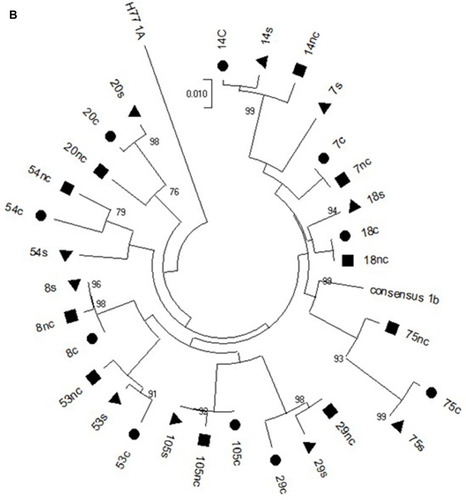
Figure 1 (A) Phylogenetic analysis of the NS3 HCV region in the cancer (circle), non-cancer (quadrate) and serum (triangle) samples of the Cases. (B) Phylogenetic analysis of the CORE HCV region in the cancer (circle), non-cancer (quadrate) and serum (triangle) samples of the Cases. (C) Phylogenetic analysis of the NS5A HCV region in the cancer (circle), non-cancer (quadrate) and serum (triangle) samples of the Cases.
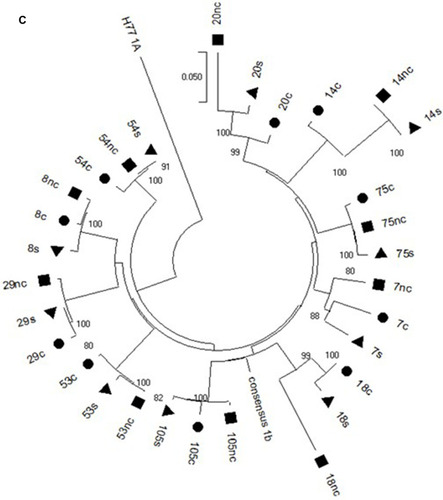
Table 2 Number of aa Substitutions in Core, NS3 and NS5A Regions for the Cases and Controls
Table 3 Prevalence of Patients with More Frequent* Amino Acid Substitutions at Different Positions of the Core Region
Table 4 Prevalence of Patients with More Frequent* Amino Acid Substitutions at Different Positions of the NS3 Region
Table 5 Prevalence of Patients with More Frequent* Amino Acid Substitutions at Different Positions of the NS5A Region
Table 6 Positions of Amino Acid (aa) Substitutions in NS3, NS5A and Core Region, Amino Acid Substitutions Identified and the Compartments in Which These Were Found