Figures & data
Table 1 Source of Clinical Pseudomonas aeruginosa Strains (n=150)
Table 2 Characteristics of Group of Pseudomonas aeruginosa Strains (n=150)
Table 3 MIC Range, MIC50, MIC90, and Susceptible Rate of C/T, C/A, M/V, and Colistin Against Pseudomonas aeruginosa Strains (n=150)
Table 4 Summarized MIC Range, MIC50, MIC90, and Susceptible Rate of C/T, C/A, and M/V Against CRPA Strains (n=120)
Table 5 MIC Range, MIC50, MIC90, MBC Range, MBC50, and MBC90 of Ceragenins Against Pseudomonas aeruginosa Strains (n=150)
Figure 1 Range of the minimum inhibitory concentrations (MICs) of ceftolozane-tazobactam, meropenem-vaborbactam and ceftazidime-avibactam recorded for P. aeruginosa strains (A - group I, C- group II, E - group III, G - group IV, I - group V) and CSAs (CSA-13, CSA-44, CSA-131) (B - group I, D - group II, F - group III, H - group IV, J - group V). Compared for the reference strain of P. aeruginosa ATCC 27853 MIC value for ceftolozane-tazobactam was 0.75 μg/mL, ceftazidime-avibactam – 0.75 μg/mL, meropenem-vaborbactam – 0.25 μg/mL, CSA-13 – 2 μg/mL, CSA-44 - 2 μg/mL and CSA-131 - 1 μg/mL.
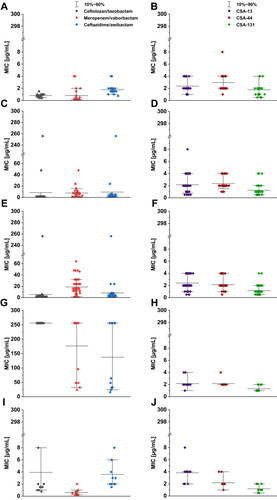
Figure 2 Range of the minimum inhibitory concentrations (MIC) of CSA ((A) CSA-13, (B) group CSA-44, (C) group CSA-131) in combination with pluronic F127 0.5, 1, 2, and 5% in doses of 1–50 μg/mL.
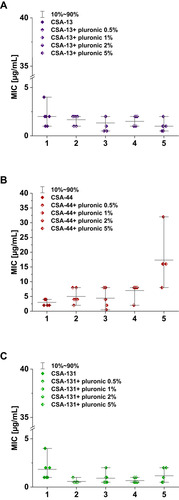
Table 6 Summarized MIC Range, MIC50, MIC90 MBC Range, MBC50, and MBC90 of CSA13, CSA44, and CSA131 Against CRPA Strains (n=120)
Figure 3 MICs values for P. aeruginosa ATCC 27853 (A), and representative strains from group I (B), group II (C), group III (D), group IV (E), and group V (F) of CSA-13, CSA-44, and CSA-131 during serial passages.
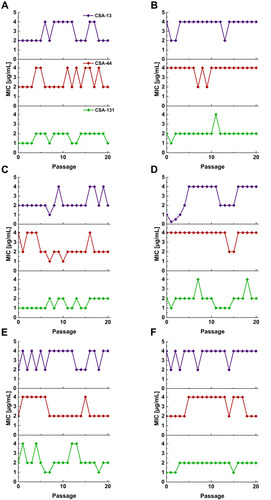
Figure 4 Relative biofilm mass of P. aeruginosa during treatment with CSA-13, CSA-44, and CSA-131. Formation of biofilm in the presence of CSAs ranging from 1–50 μg/mL was assessed using the resazurin-based fluorimetric method after 24 (A), 48 (B), and 72 (C) hours incubation. Results show mean±SD from three measurements. * indicates statistical significance.
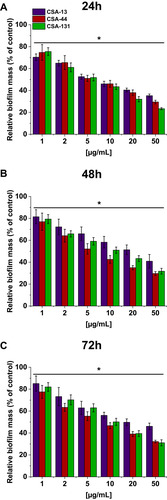
Figure 5 Hemoglobin release from human red blood cells (RBCs) incubated in the presence of CSA-13 (A–C), CSA-44 (D–F), and CSA-131 (G–I) alone and with 1%, 2%, and 5% pluronic at doses of 1–50 μg/mL after 1 hour (A, D, G), 6 hours (B, E, H), and 12 hours (C, F, I). Results show mean±SD, n=3; * indicates statistical significance.
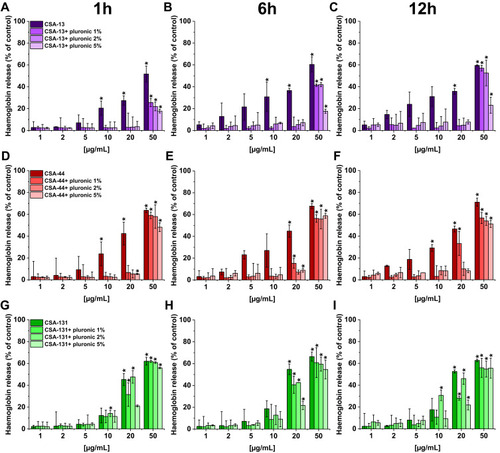
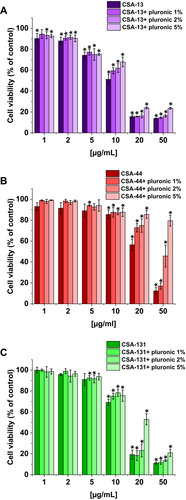
Figure 6 Viability of lung adenocarcinoma cells (A549) upon treatment with CSA alone and with 1%, 2%, and 5% pluronic at doses of 1–50 μg/mL. CSA-13 (A), CSA-44 (B), and CSA-131 (C). Results show: mean±SD, n=3; * indicates statistical significance.