
Figures & data
Table 1 Search Terms by Category*
Figure 1 Study selection flow diagram.
Notes: PRISMAfigureadaptedfromPage MJ, McKenzie JE, Bossuyt PM, Boutron I, Hoffmann TC, Mulrow CD, et al. The PRISMA 2020 statement: an updated guideline for reporting systematic reviews. BMJ 2021;372:n71.CreativeCommons.Citation26
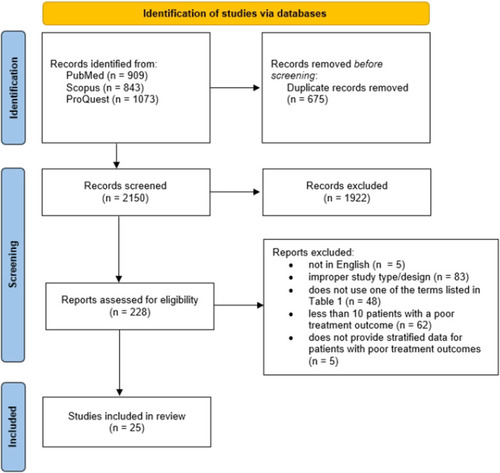
Table 2 Study, Region, and Participant Characteristics for Included Articles
Figure 2 Quality assessment score by study with the Joanna Briggs Institute’s Tools.
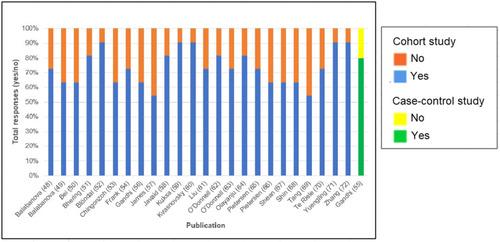
Table 3 Characteristics of Patients with XDR-TB and Having Poor Outcomes