
Figures & data
Table 1 Clinical Samples from Which Salmonella Was Isolated
Table 2 Age and Gender Distribution of Patients from Whom Salmonella Was Isolated
Figure 1 Resistance of all Salmonella groups during different years. Significant difference between periods for prevalence of resistance for antibiotics is as follows: 2015–2017 vs 2018–2020 for ampicillin (P=0.03); 2006–2008 vs 2018–2020 (P=0.002) and 2015–2017 vs 2018–2020 (P=0.02) for trimethoprim; 2006–2008 vs 2015–2018 (P=0.05) for gentamicin; 2006–2008 vs 2018–2020 (P=0.0001) and 2009–2011 vs 2018–2020 (P=0.0001) for ciprofloxacin; 2006–2008 vs 2018–2020 (P=0.0001), 2009–2011 vs 2018–2020 (P=0.0001), 2015–2017 vs 2018–2020 (P=0.0001), and 2012–2014 vs 2018–2020 (P=0.0008) for tigecycline.
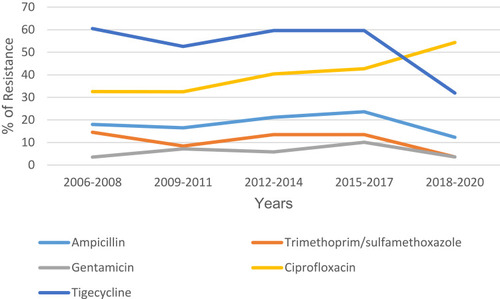
Figure 2 Resistance of Salmonella groups B and D for the five periods against ampicillin. Significant difference between periods for prevalence of resistance for ampicillin is as follows: 2006–2008 vs 2009–2011 (P=0.03) in Salmonella group B; and 2009–2011 vs 2015–2017 (P=0.02) and 2015–2017 vs 2018–2020 (P=0.02) in Salmonella group D.
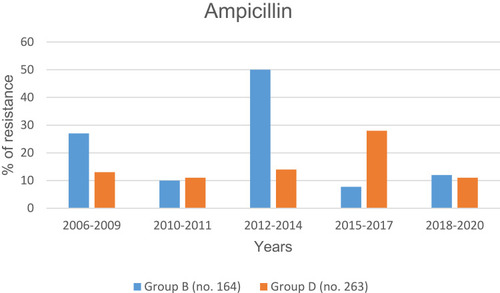
Figure 3 Resistance of Salmonella group D for the five periods against ciprofloxacin. Significant difference between periods for prevalence of resistance for ciprofloxacin is as follows: 2006–2008 vs 2018–2020 (P=0.0004); 2009–2011 vs 2012–2014 (P=0.03); 2009–2011 vs 2015–2017 (P=0.01); 2009–2011 vs 2018–2020 (P=0.0001); 2012–2014 vs 2015–2017 (P=0.02); and 2015–2017 vs 2018–2020 (P=0.0002).
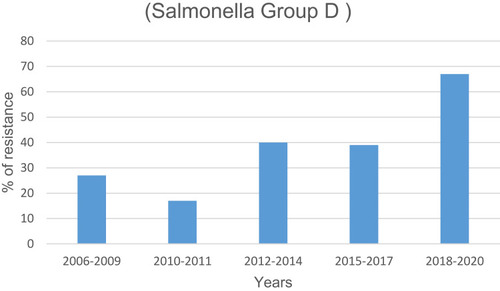
Figure 4 Resistance of Salmonella groups B, C and D for the five periods against tigecycline. Significant difference between periods for prevalence of resistance for tigecycline is as follows: 2006–2008 vs 2009–2011 (P=0.03) and 2006–2008 vs 2018–2020 (P=0.0005) in Salmonella group B; 2006–2009 vs 2018–2020 (P=0.002) and 2009–2011 vs 2018–2020 (P=0.01) in Salmonella group C; and 2006–2008 vs 2018–2020 (P=0.04), 2012–2014 and 2018–2020 (P=0.02) and 2015–2017 vs 2018–2020 (P=0.005) in Salmonella group D.
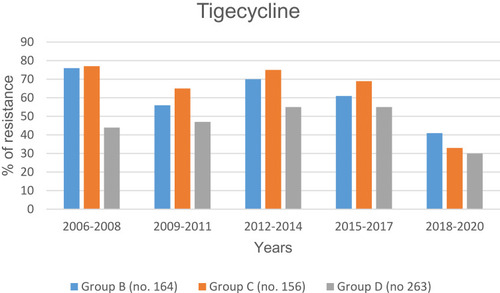
Table 3 Resistance Phenotypes of All 700 Salmonella Isolates