
Figures & data
Table 1 Clinical Data and Surgical Characteristics of the 101 Patients
Figure 1 (A) Least absolute shrinkage and selection operator (LASSO) coefficient profiles of four sarcopenia-associated variables. IMAC, VSR, age and SMI were finally selected as significant variables by LASSO logistic regression. The blue line represents IMAC, the green line represents VSR, the black solid line represents age, and the bottom red line represents SMI. A dashed vertical line is drawn at log(λ) = −3.317, which was chosen by 10-fold cross-validation. IMAC, intramuscular adipose tissue content; VSR, visceral to subcutaneous adipose tissue area ratio; SMI, skeletal muscle mass index. (B) The partial likelihood deviance (binomial deviance) for the LASSO coefficient profiles. The red dots represent the average partial likelihood deviances for every model with a given lambda. A dotted vertical line represents the partial likelihood deviance error at log(λ) = −3.317.
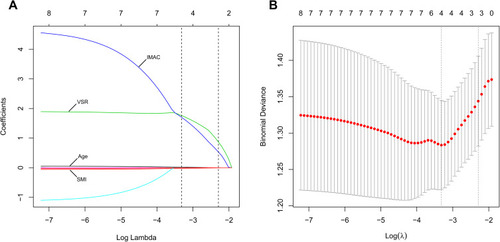
Table 2 Logistic Regression Analyses for Major Postoperative Complications
Figure 2 Nomogram for predicting major postoperative complications (Clavien-Dindo ≥ IIIa). The nomogram represents the predicted probability of major postoperative complications on a scale of 0 to 180. For each predictor, draw a vertical line straight up to the point axis and note the corresponding points. Sum the points from each predictor, and the total score corresponding to a predicted probability of major postoperative complications can be found at the bottom of the nomogram.
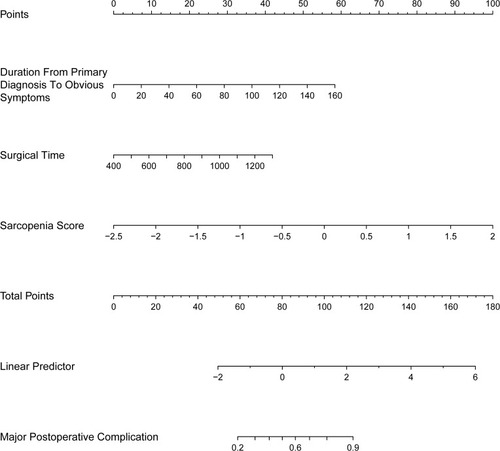
Figure 3 Receiver operating characteristic (ROC) curve and calibration curve for predicting major postoperative complications (Clavien-Dindo grade ≥ IIIa). (A) ROC curve for the prediction model obtained by the bootstrapping method (resample: 500), with an area under the receiver operating characteristic curve (AUROC) of 0.807 (95% CI, 0.720–0.895). (B) Calibration curve for the prediction model. The X-axis represents the predicted probability of major postoperative complications according to the prediction model. The vertical black lines on the X-axis represent the distribution of the samples. The Y-axis represents the observed probability of major postoperative complications. The red line shows an ideal prediction corresponding to the actual observations. The black line represents the performance of the calibration curve with the bootstrapping method (resample: 500).
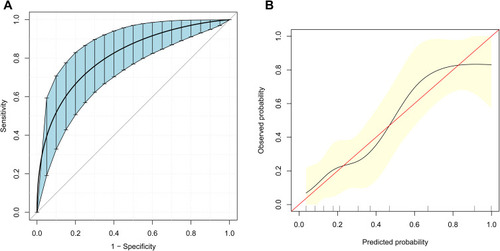
Table 3 Clinical Data and Surgical Characteristics of the Patients in the Low-Risk Group and the High-Risk Group