
Figures & data
Table 1 MIC-Related Parameters from Different Specimens
Table 2 MIC-Related Parameters from Different Regions
Table 3 MIC-Related Parameters, 2018–2020
Figure 1 Trend over time of antimicrobial susceptibility of MRSA isolates in 2018 (n = 135), in 2019 (n = 141), and 2020 (n = 131) against vancomycin (A) teicoplanin (B) linezolid (C) and daptomycin (D).
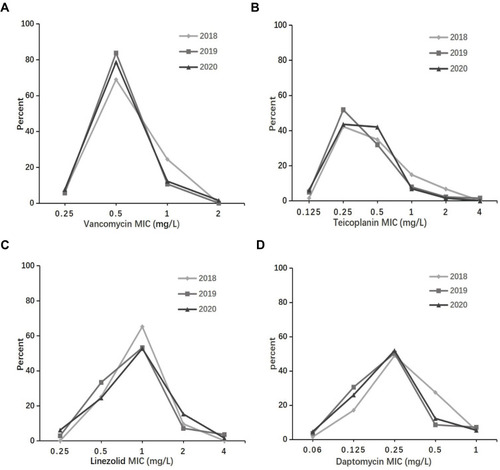
Table 4 MIC Values of Teicoplanin, Linezolid and Daptomycin Stratified by MIC Values of Vancomycin