Figures & data
Table 1 Characterization of Individuals with Acute Brucellosis and Healthy Controls
Table 2 Serum Th1/Th2/Th17 Cytokine Levels and General Inflammatory Markers in Patients with Acute Brucellosis Pre- and Post-Treatment and Healthy Controls
Figure 1 Serum IL-2, IFN-γ, TNF-α, IL-17A, IL-4, IL-6, and IL-10 levels in patients with brucellosis before and after treatment and in healthy controls. Comparisons of the level of seven cytokines, including (A) IL-2, (B) IFN-γ, (C) TNF-α, (D) IL-17A, (E) IL-4, (F) IL-6, and (G) IL-10 in patients with acute brucellosis before treatment (pre-treatment) and at 6 weeks after treatment (post-treatment) and healthy controls (HC) (n = 30, 30, and 26, respectively) are shown. Values are expressed in Log10 (pg/mL). Medians are indicated with horizontal lines. P values were calculated using the Mann–Whitney U-test for differential analysis of controls and patients and the Wilcoxon matched-pair signed-rank test for comparisons of patients before and after treatment.
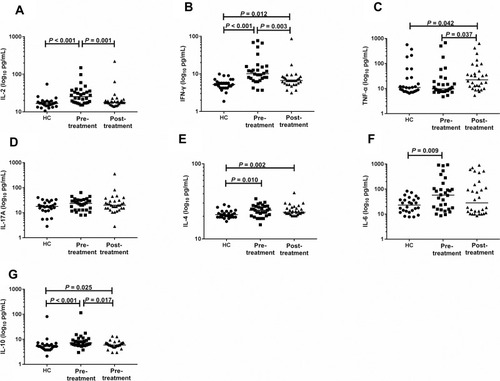
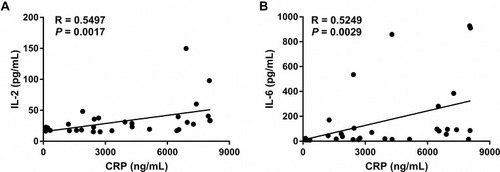
Table 3 Correlations Between Serum Th1/Th2/Th17 Cytokines with General Inflammatory Markers in Patients with Acute Brucellosis (n = 30)
Figure 2 Correlations between selected serum Th1/Th2/Th17 cytokines and CRP. Spearman correlation coefficient (R) was used to evaluate correlations between CRP and serum IL-2 (A) and IL-6 (B) in patients with acute brucellosis (n=30).