
Figures & data
Figure 1 Timeline of the patient’s illness and treatment in the hospital. Time in days is shown along the x axis with treatment, clinical manifestation, and laboratory diagnosis along the y axis. The patient was sent to the Emergency Department on Day 1 and transferred to the Department of Infectious Diseases in the following days. We reported a positive blood culture result on day 8.
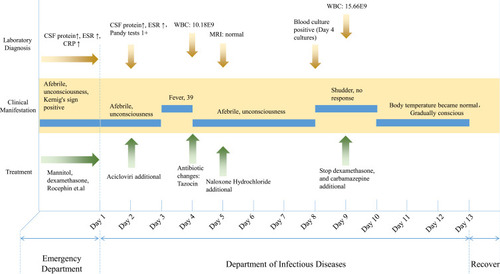
Table 1 Comparison of Biochemical Reactions and AST Results Between YFY001 and Other Janibacter
Figure 2 Genomic analysis of Janibacter YFY001. (A) Circular representation of the Janibacter YFY001 genome with predicted CDSs. Circles range from 1 (outer circle) to 8 (inner circle). Circles 1 and 2, genes on forward and reverse strands; circle 3, tRNA genes; circle 4, genomic island; circle 5, predicted resistance genes; circle 6, rRNA genes; circle 7, GC bias ((G-C)/(G + C); red indicates values >0; blue indicates values <0); circle 8, G+C content. (B) COG analysis of Janibacter YFY001 genome. (C) Genomic islands in Janibacter YFY001. Different colors represent different COGs.
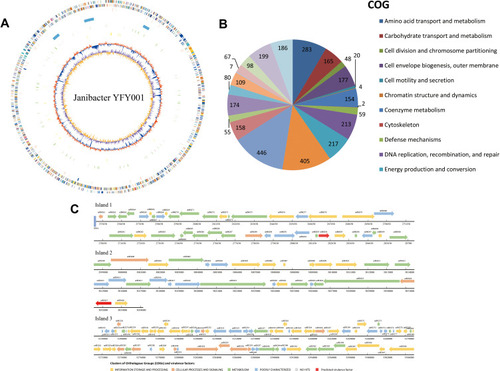
Table 2 Basic Statistics of the Janibacter YFY001 Genome Sequenced in This Study, Compared with Those of Janibacter PVAS, and HTCC2649
Figure 3 Comparative genomic analysis using Janibacter YFY001, PVAS, and HTCC 2649 genomes. (A) Venn figure of the comparative genomic results. (B) COG analysis of the comparison results.
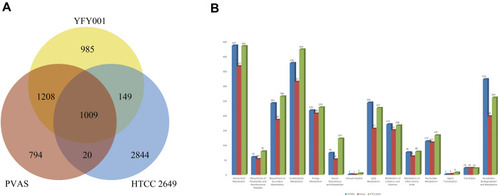
Table 3 Predicted Antibiotic Resistance Genes
Table 4 Similarities and Identities Between Different Bacteria with FbpABC Operon