
Figures & data
Figure 1 Distribution map of MDR-TB isolates included in this study. The number following the site number represents the number of isolates obtained from that site.
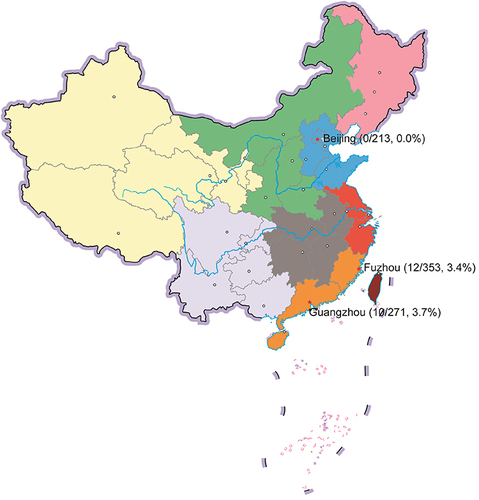
Figure 2 MeltPro Myco assay melting peaks revealing mixed infections. (A) MTB alone; (B) mixed infection by mixed infection by M. tuberculosis and M. intracellulare; (C) mixed infection by mixed infection by M. tuberculosis and M. avium; (D) mixed infection by mixed infection by M. tuberculosis and M. abscessus; IPC, internal positive control.
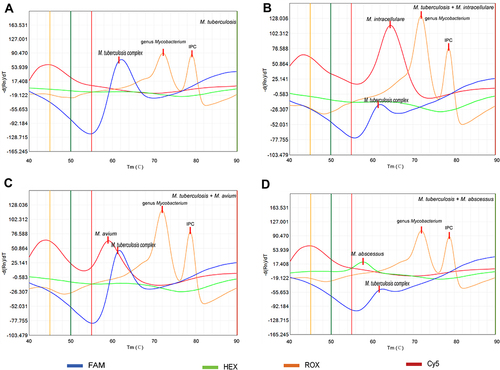
Figure 3 Distribution of NTM species identified in mixed infection cases.
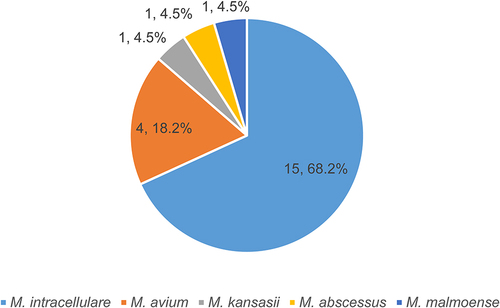
Table 1 Demographic and Clinical Characteristics Associated with Mixed Infection of MTB and NTM