
Figures & data
Figure 1 Approximate diagram of the spatial distribution of electric charge in SARS-CoV-2 (B.1 variant). The resultant formal charge, estimated from the charged amino acid content of the envelope (E), the membrane (M), and the nucleocapsid protein (N) is positive (blue), respectively 2, 8, 24 elementary charge units [e]. The entire charge of spike protein (S) is negative (red), −12 [e], but locally, in the RBD, the resultant charge is positive, +7 [e], as was reported in Pawłowski’s study.Citation5
![Figure 1 Approximate diagram of the spatial distribution of electric charge in SARS-CoV-2 (B.1 variant). The resultant formal charge, estimated from the charged amino acid content of the envelope (E), the membrane (M), and the nucleocapsid protein (N) is positive (blue), respectively 2, 8, 24 elementary charge units [e]. The entire charge of spike protein (S) is negative (red), −12 [e], but locally, in the RBD, the resultant charge is positive, +7 [e], as was reported in Pawłowski’s study.Citation5](/cms/asset/97d7e598-eccd-4186-bcc2-9684440c7f4b/didr_a_342068_f0001_c.jpg)
Table 1 Mutations in SARS-CoV-2 Variants of Concern as of 8 July 2021 (ECDC Report) the Data in Columns Were Collected for All Reported Lineages and Their Mutations. Many Mutations Occur in Several Lineages
Figure 2 A mean increase of formal electric charge in RBD and S1/S2 cleavage regions in the lineages monthly reported by ECDC from September 2020 to June 2021. The formal charge means the charge of the amino acids at neutral pH, in elementary charge units. The reference “wild-type’” virus B.1 was assumed (with no mutation D614G and other spike protein changes). The standard deviation of the population (vertical bar) was shown.
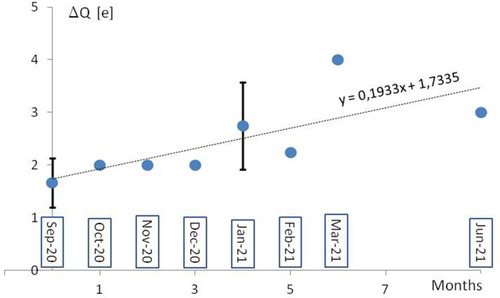
Figure 3 The distribution of reported by ECDC 32 mutations (126 cases in 34 lineages). Mutations and the formal charge change are listed in .
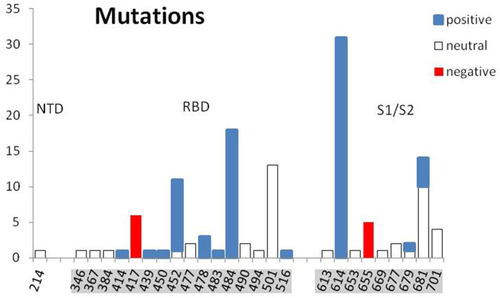
Figure 4 The COVID-19 percentage case fatality vs formal charge changes in RBD and S1/S2 cleavage regions according to PHE. In the case of WHO labeled variants, Alpha and Zeta the mean change of the charge were calculated for 2 and 5 lineages. Only well-documented variants first detected in the UK, South Africa, Japan ex Brazil, and Brazil were presented. According to the Public Health England (PHE).Citation11
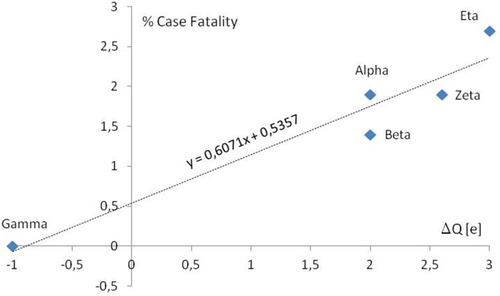
Figure 5 Conceptual visualization of the final model built using Weka 3.8.5 MultilayerPerceptron classifier for decision making, relating attributes of virus lineages to the evidence for impact on immunity {no, neutralization, escape}. For simplicity only selected 10 mutations are shown in the input layer of neuronal networks. Circles represent neurons and lines represent synapses. The model contains the input layer of considered attributes (32 mutations, time of the first detection, the total change of charge in S, the charge change in RBD, and the charge change in the S1/S2 cleavage area), one hidden layer to process the classification decision, and the output layer of classes for impact on immunity. Synapses take the input and multiply it by a fitted weight. Neurons add the outputs from all synapses and apply a sigmoid transfer function with a fitted threshold.
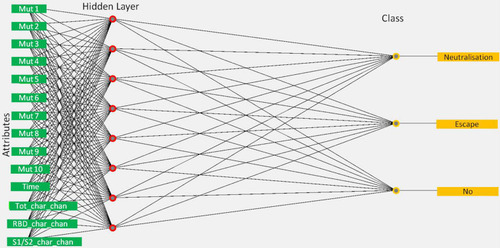
Figure 6 The potential electrostatic screened energy U is estimated for charged RBD and ACE2 as a function of a distance d. Point model and screened Coulomb energy U=Q1Q2Exp(-d/LD)/(4Πε0εd) was assumed, with Q1= +7 [e] or Q1= +10 [e], Q2= −28 [e], ε= 80, and Debye screening length LD= 0.7 nm. The ε0 is the dielectric permittivity of a vacuum. Two curves represent different RBD charges, referential (+7 [e]) and after positive charge mutation (+10 [e]), as in virus variant Zeta A.V1. The arrow indicates the direction of attraction of the positive electric charge.
![Figure 6 The potential electrostatic screened energy U is estimated for charged RBD and ACE2 as a function of a distance d. Point model and screened Coulomb energy U=Q1Q2Exp(-d/LD)/(4Πε0εd) was assumed, with Q1= +7 [e] or Q1= +10 [e], Q2= −28 [e], ε= 80, and Debye screening length LD= 0.7 nm. The ε0 is the dielectric permittivity of a vacuum. Two curves represent different RBD charges, referential (+7 [e]) and after positive charge mutation (+10 [e]), as in virus variant Zeta A.V1. The arrow indicates the direction of attraction of the positive electric charge.](/cms/asset/664a6fb9-ccf7-4073-b25b-dd7af8565435/didr_a_342068_f0006_c.jpg)