
Figures & data
Table 1 Baseline Socio-Demographic, Laboratory and Clinical Characteristics of the Study Participants in Both Moxifloxacin and Levofloxacin Groups
Table 2 Duration of Treatment and Number of Companion Drugs Included in Moxifloxacin-and Levofloxacin-Based Regimens
Table 3 Treatment Outcome, Sputum Culture Conversion and Line Probe Assay Results by Treatment Regimen of the Study Subjects with MDR-TB
Figure 1 Summary of the Molecular line probe assay for the two core groups of second- line drugs.
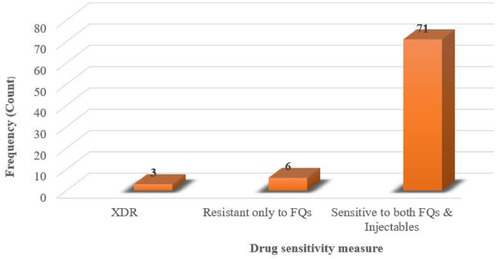
Table 4 Univariate and Backward Multivariate Cox Proportional Hazard Regression to Determine Outcome Predicting Factors in MDR-TB Patients
Figure 2 Kaplan–Meier curve showing the probability of survival of MDR-TB patients for moxifloxacin-and levofloxacin-based regimens since commencement to end of treatment follow-up.
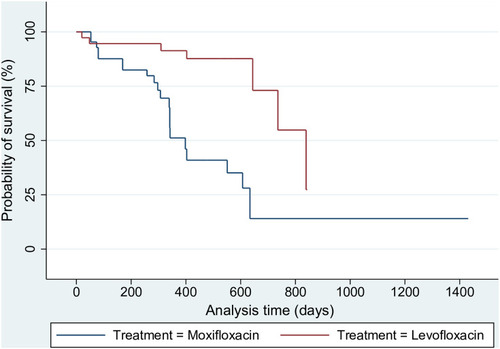
Figure 3 Kaplan–Meier analysis comparing time-to-culture positivity between moxifloxacin- and levofloxacin-based regimens treated MDR-TB patients (n=80).
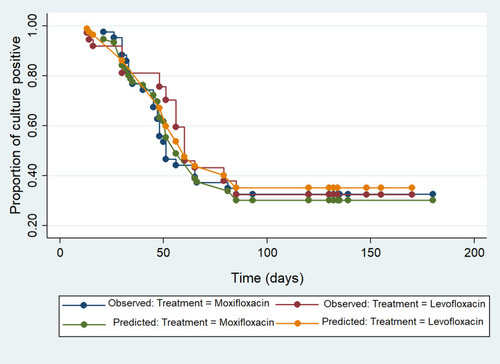
Table 5 Multivariate Cox Proportional Hazard Regression Analysis of Treatment Outcome Predicting Covariates in MDR-TB Patients
Table 6 Adverse Drug Reactions Occurred Among the MDR-TB Patients