
Figures & data
Table 1 Sample Size Calculation for the Study Using Double Population Proportion
Table 2 Table Showing Age Specific Attack Rate of the Outbreak
Table 3 Table Showing Attack Rate of the Outbreak by Kebeles of the District
Figure 1 Measles cases by age category, Guradamole District, Bale Zone, Southeastern Ethiopia, 2021.
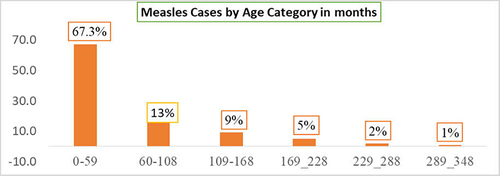
Figure 2 Epi curve showing date of onset symptom and number of measles cases reported in Guradamole District, Bale Zone, Southeastern Ethiopia, 2021.
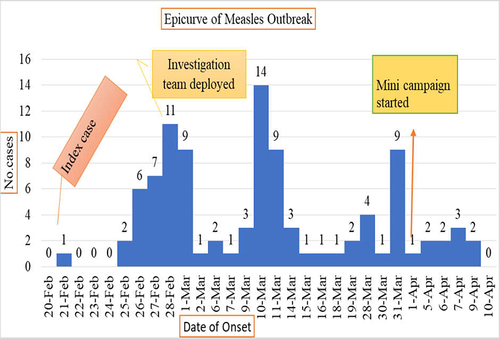
Table 4 Table Showing Percent of Measles Cases with Signs and Symptoms
Figure 3 Graph showing vaccination status of cases Guradamole District, Bale Zone, Southeastern Ethiopia, 2021.
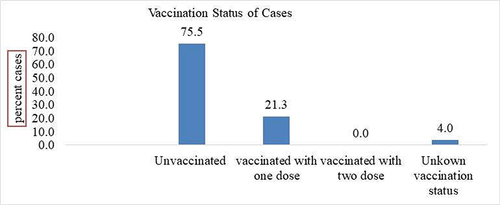
Table 5 Table Showing Sociodemographic Characteristic of Cases and Controls
Table 6 Table Showing Candidate Variables in Bivariate Logistic Regression for the Multivariate Analysis
Table 7 Variables Independently Associated with Measles Infection in Multivariate Logistic Regression