Figures & data
Table 1 General Characteristics and Antimicrobial Susceptibility of CR-KP Isolates
Figure 1 PFGE dendrogram of CR-KP isolates from March, 2017 to February, 2019. All the strains were divided into three clusters. Cluster A belongs to ST147, Clusters B belongs to 3444 and Clusters C belongs to ST17.
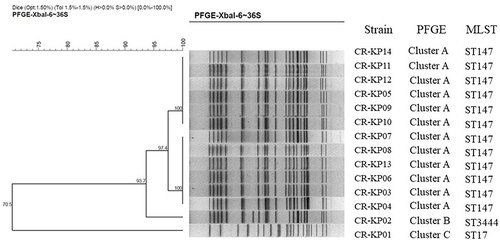
Figure 2 Biofilm formation and serum complement-mediated killing of selected CR-KP isolates. (A) Biofilm formation of CR-KP 01 belongs to ST17, CR-KP 14 belongs to ST147 and CR-KP 02 belongs to ST3444. (B) Serum complement-mediated killing of selected CR-KP isolates.
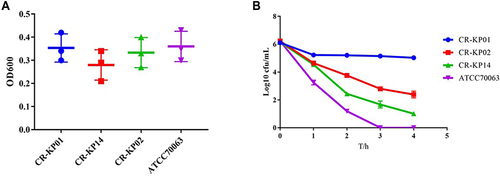
Figure 3 Virulence potential of K. pneumoniae strains in a Galleria mellonella infection model. (A) The survival rate of G. mellonella infected with CR-KP 01inoculum of 1×10⁸ CFU/mL, 1×10⁶ CFU/mL and 1×10⁴ CFU/mL. (B) The survival rate of G. mellonella infected with CR-KP 14 inoculum of 1×10⁸ CFU/mL, 1×10⁶ CFU/mL and 1×10⁴ CFU/mL. (C) The survival rate of G. mellonella infected with CR-KP 02 inoculum of 1×10⁸ CFU/mL, 1×10⁶ CFU/mL and 1×10⁴ CFU/mL.
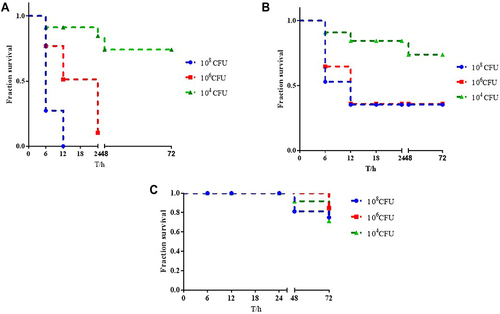
Figure 4 The characteristics of type I and Type II. (A) PFGE dendrogram of these two types. (B) Biofilm formation of type I and Type II. (C) Serum complement-mediated killing of these two types. (D) Virulence potential of type I and Type II in a Galleria mellonella infection model.
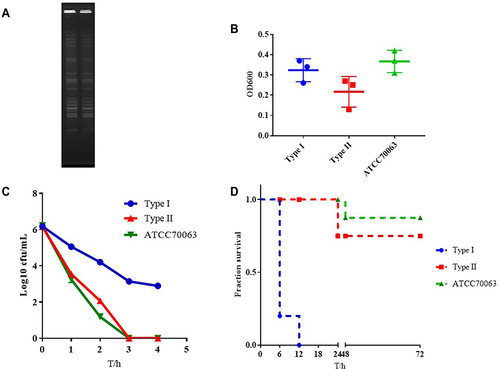
Figure 5 The transcriptomes of type I and Type II. (A) Histogram presentation of GO classification. M: Cell wall/membrane/envelope biogenesis; N: Cell motility; O: Posttranslational modification, protein turnover, chaperones; U: Intracellular trafficking, secretion, and vesicular transport; K: Transcription; L: Replication, recombination and repair; C, Energy production and conversion; E: Amino acid transport and metabolism; F: Nucleotide transport and metabolism; G: Carbohydrate transport and metabolism; H: Coenzyme transport and metabolism; I: Lipid transport and metabolism; P: Inorganic ion transport and metabolism; Q: Secondary metabolites biosynthesis, transport and catabolism; S: Function unknown; The y-axis indicates the number of genes in each category. (B) COG functional classification of type I and Type II.
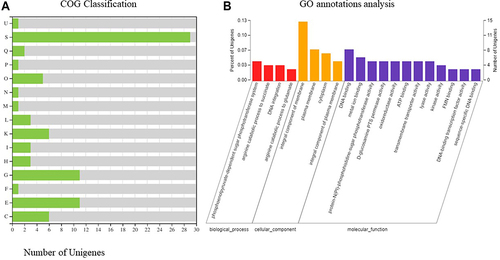
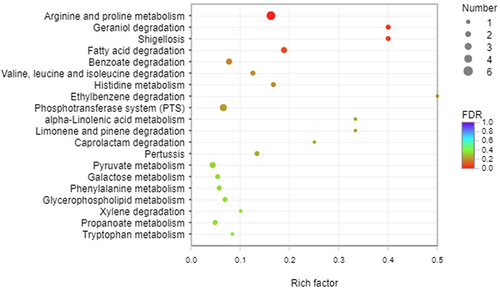
Figure 6 KEGG pathway analysis of type I and Type II. A total of 115 DEGs were assigned to 41 KEGG pathways. KEGG pathway analysis showed that 10 pathways were obviously changed (P-value <0.05) in theType I. Arginine and proline metabolism, fatty acid degradation, geraniol degradation and phosphotransferase system were overexpressed in type I.