Figures & data
Figure 1 Overexpression of HBx elevates PAR2 protein level in LO2 cells. (A) The protein level of HBx in LO2 cells transfected with pcDNA3.1-HBx was measured by Western blotting. (B) The protein level of PAR2 in LO2 cells transfected with pcDNA3.1-HBx was measured by Western blotting. **P < 0.01 vs the vector group. The experiments were performed in triplicate.
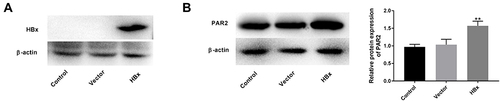
Figure 2 Inhibition of PAR2 reverses the influences of HBx overexpression on the proliferation and apoptosis of LO2 cells. (A) The proliferation of LO2 cells under different treatments was measured by EdU assay. (B) The apoptosis of LO2 cells under different treatments was analysed using a flow cytometer. *P < 0.05 vs the HBx(-) + FSL(-) group. #P < 0.05 vs the HBx(+) + FSL(-) group. The experiments were performed in triplicate.
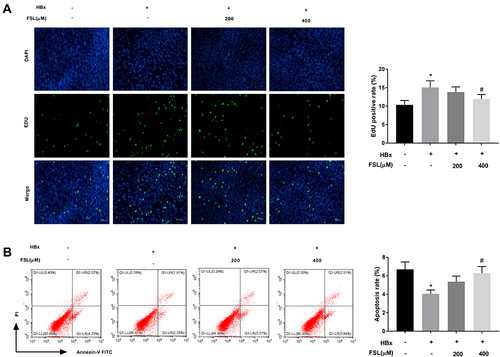
Figure 3 Suppression of PAR2 attenuates HBx-induced mitochondria oxidative stress in LO2 cells. (A) ROS generation assay was performed using flow cytometry analysis. (B) The level of GSH in LO2 cells under different treatments. (C) The level of SOD in LO2 cells under different treatments was measured by a commercial kit. (D) The level of MDA in LO2 cells under different treatments was measured by a commercial kit. (E) MMP value in LO2 cells under different treatments. (F) ATP value in LO2 cells under different treatments. (G) H2O2 concentration in LO2 cells under different treatments. *P < 0.05 vs the HBx(-) + FSL(-) group. #P < 0.05 vs the HBx(+) + FSL(-) group. The experiments were performed in triplicate.
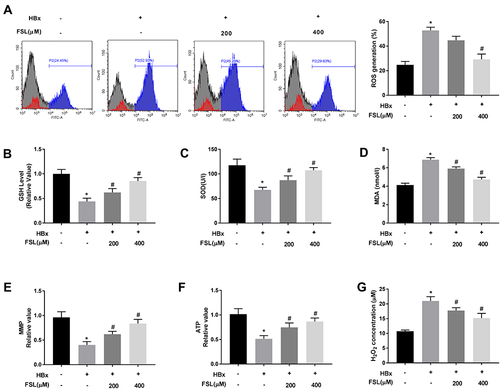
Figure 4 Decreased PAR2 represses inflammation responses in HBx overexpressed LO2 cells. (A) The mRNA expression of TNF-α, IL-6, and CXCL-2 in LO2 cells under different treatments was detected by qRT-PCR. (B) The protein level of TNF-α, IL-6, and CXCL-2 in LO2 cells under different treatments was measured by ELISA. *P < 0.05 vs the HBx(-) + FSL(-) group. #P < 0.05 vs the HBx(+) + FSL(-) group. The experiments were performed in triplicate.
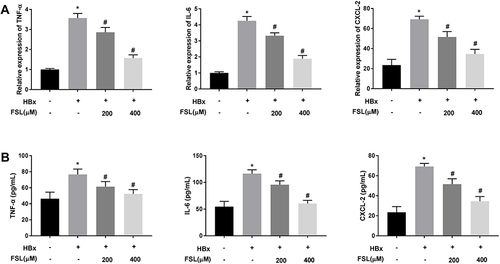
Figure 5 PAR2 knockdown alleviates HBx-induced liver injuries in a mouse model (n = 8 in each group). (A) The protein levels of HBx and PAR2 in PAR2-KO mice after injection of pcDNA3.1-HBx. (B) The levels of AST and ALT in PAR2-KO mice after injection of pcDNA3.1-HBx were measured by the corresponding commercial kits. *P < 0.05 vs the control mice group. #P < 0.05 vs the WT mice + pcDNA3.1-HBx group. (C) The HE staining and (D) immunohistochemistry assay of PAR2-KO mice after injection of pcDNA3.1-HBx.
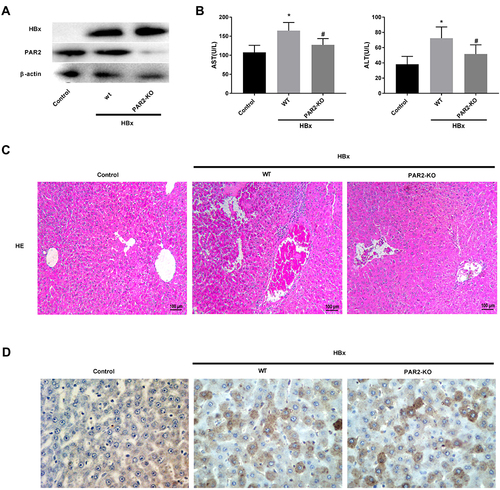
Figure 6 Inflammation caused by HBx is improved in PAR2-KO mice (n = 8 in each group). (A) The mRNA expression of TNF-α, IL-6, and CXCL-2 in liver tissues of PAR2-KO mice was detected by qRT-PCR. (B) The protein level of TNF-α, IL-6, and CXCL-2 in liver tissues of PAR2-KO mice was measured by ELISA. *P < 0.05 vs the control mice group. #P < 0.05 vs the WT mice + pcDNA3.1-HBx group.
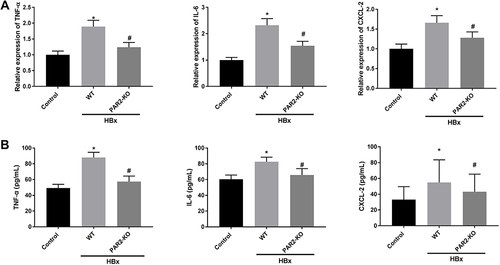
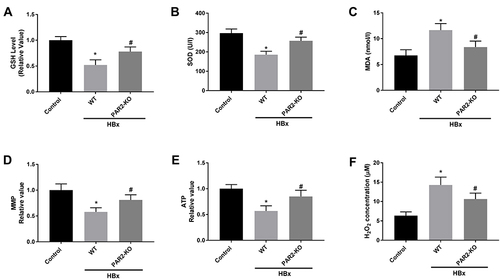
Figure 7 Mitochondria oxidative stress caused by HBx is alleviated in PAR2-KO mice (n = 8 in each group). (A) The level of GSH in liver tissues of PAR2-KO mice. (B) The level of SOD in liver tissues of PAR2-KO mice was measured by a commercial kit. (C) The level of MDA in liver tissues of PAR2-KO mice was measured by a commercial kit. (D) MMP value in liver tissues of PAR2-KO mice. (E) ATP value in liver tissues of PAR2-KO mice. (F) H2O2 concentration in liver tissues of PAR2-KO mice. *P < 0.05 vs the control mice group. #P < 0.05 vs the WT mice + pcDNA3.1-HBx group.