Figures & data
Table 1 MIC, BIC80 and BEC80 of AMP-17 Against Cryptococcus neoformans
Figure 1 Inhibition and killing kinetics of AMP-17 against C. neoformans IFM56769 planktonic cells. (A) Optical density measurements of exponentially growing C. neoformans at 630 nm in the presence and absence of AMP-17 (1~8 MIC). (B) Time-killing kinetics of AMP-17 against C. neoformans. C. neoformans cells (105 CFU/mL) were cultured in wells containing AMP-17 (1~8× MIC) to determine the killing of AMP-17 against planktonic cells. Values are the mean ± standard deviation of two experiments in triplicate and were analyzed by one-way ANOVA. Compared with the control, the asterisk represents statistically significant differences (***P < 0.001).
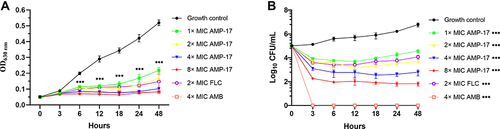
Figure 2 AMP-17 treatment induces nucleotide release from C. neoformans IFM56769. Values are the mean ± standard deviation of two experiments in triplicate and were analyzed by one-way ANOVA. Compared with the control, the asterisk represents statistically significant differences (*P < 0.05, **P < 0.01).
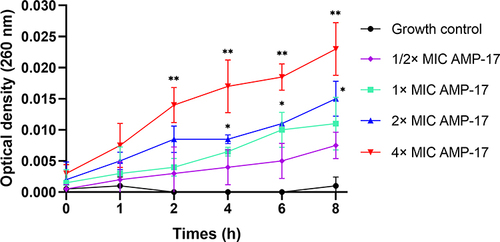
Figure 3 AMP-17 induced membrane permeabilization of C. neoformans IFM56769. The fluorescence intensity of propidium iodide (PI) after 6 h of treatment with different concentrations of AMP-17 (1, 2, and 4× MIC) was detected by flow cytometry. One representative results out of two independent experiments is shown. Compared with the control, the asterisk represents statistically significant differences (*P < 0.05, **P < 0.01).
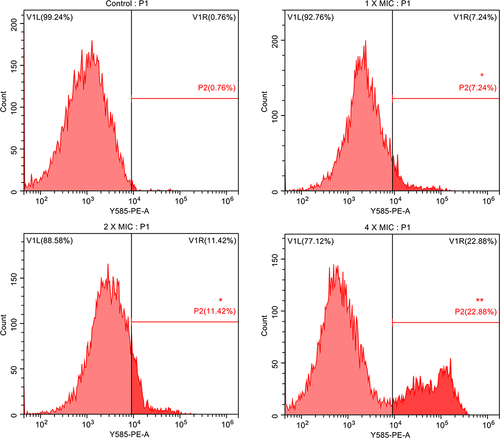
Figure 4 CLSM images of AMP-17 treated C. neoformans planktonic cells. C. neoformans planktonic cells were incubated with control and AMP-17 (1, 2 and 4× MIC) for 6 h at 35 °C. After staining with 10 μM propidium iodide (PI), the red fluorescence in samples was detected by CLSM at 530 nm and 590 nm of excitation and emission. One representative results out of two independent experiments is shown. Images were captured using a 600 × power field. Scale bar, 20 μm.
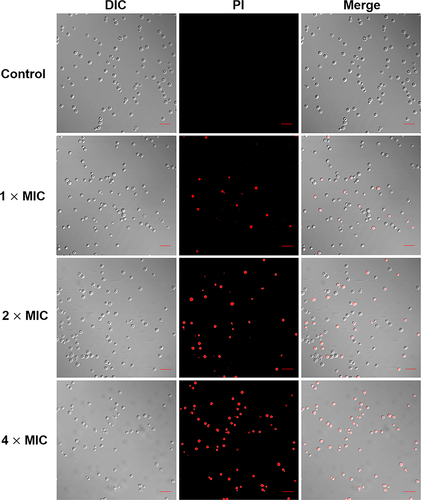
Figure 5 SEM images of AMP-17-treated C. neoformans planktonic cells. Untreated C. neoformans cells presented a round or oval appearance, and the cell surface was smooth with clear cell boundaries (A). The cells treated with AMP-17 (1, 2, and 4× MIC) at 6 h showed severe damage, such as the cell size differed greatly, the surface was sunken, irregularities in shape, and the cells ruptured and shrunk (B, C and D). One representative results out of two independent experiments is shown. Images were captured using a 3000 × power field. Scale bar, 10 μm.
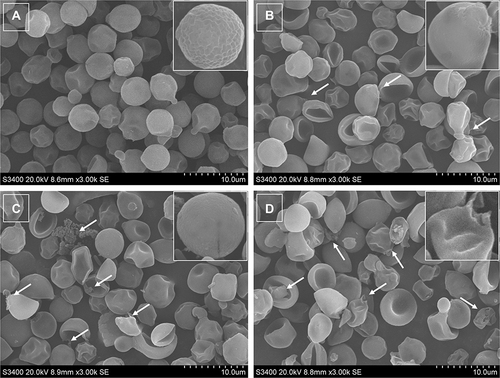
Figure 6 Effect of AMP-17 on biofilm formation and pre-biofilm of Cryptococcus sp (n=18). Biomass (A and C) and metabolic activity (B, D, E and F). Black bars represent control. Gray bars represent cells exposed to different concentrations of AMP-17, FLC and AMB. Values are the mean ± standard deviation of two experiments in triplicate and were analyzed by one-way ANOVA. Compared with the control, the asterisk represents statistically significant differences (*P < 0.05, **P < 0.01, ***P < 0.001).
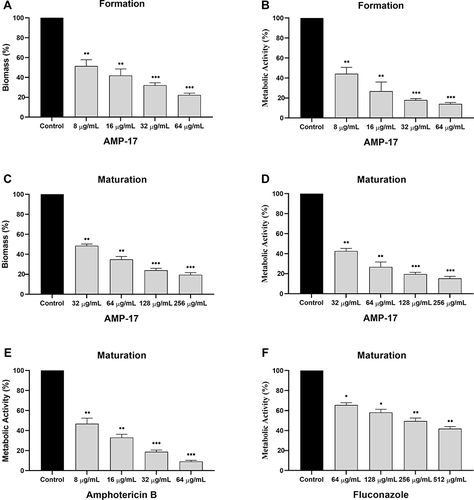
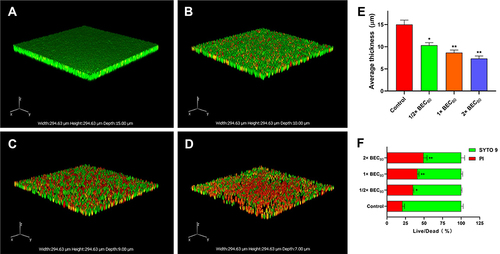
Figure 7 Quantitative analysis of pre-biofilm thickness and live/dead staining by CLSM. C. neoformans biofilms were formed on sterile polylysine-treated cover glass slides for 48 h at 35 °C (A). Biofilms were treated with AMP-17 (1/2, 1, and 2× BEC80) for 6 h at 35 °C and subsequently stained with SYTO 9 and PI for 15 min in the dark (B, C, and (D). Images were captured using a 600 × power field. The thickness (E) and live/dead ratio (F) of biofilm were calculated based on the fluorescence intensity. The results are taken from the average of three independent experiments. The data represents the mean ± SD. *P <0.05 and **P < 0.01 compared to the non-drug control.