Figures & data
Figure 1 Brain magnetic resonance imaging (MRI) The red arrows in Figure 1 indicate the possible location of the lesion. (A) left parietal lobe and occipital lobe. (B) left centrum semiovale abnormal signal, considering the possibility of inflammation.
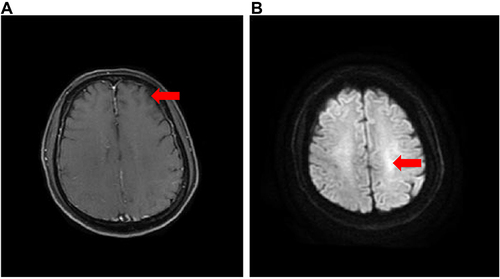
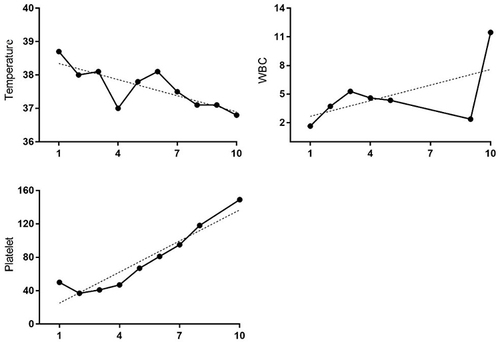
Figure 2 Clinical course: Horizontal axis represents the days after admission. Ordinate of each graph: Temperature (°C), WBC (10*9/L), Platelet (10*9/L). Dashed line represents the trend. The patient’s body temperature fluctuates up and down, but generally decreases until the body temperature returns to normal. With platelet transfusions and leukocyte promoting therapy, the patient’s platelet levels and white blood cell count increased.