
Figures & data
Table 1 Antimicrobial Susceptibility Testing of E. coli Strain TCM3e1 Isolates and Associated Transconjugants
Table 2 Genome and Plasmids of E. coli Strain TCM3e1
Figure 1 Genetic structure of plasmid pNDM-TCM3e1. This circular graph was created to illustrate the backbone and the location of the genetic load region of pNDM-TCM3e1. Genes are denoted by yellow rectangles. The GC skew is depicted as the inner circle in black and the GC content as the outer circle in green and purple. The blue region represents conjugation.
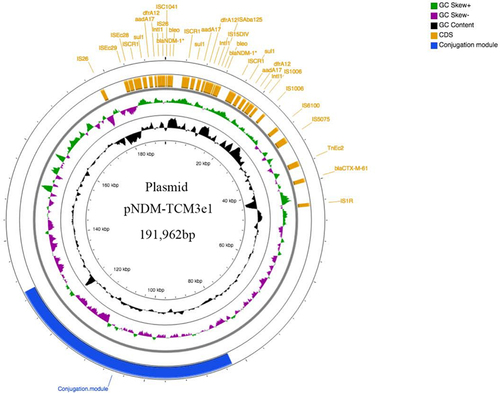
Table 3 Match in GenBank of the E. coli Strain TCM3e1 Plasmid
Figure 2 Alignment of sequences surrounding the region of blaNDM-1. Genes are denoted by arrowheads and colored based on gene function classification. Red letters are for blaNDM-1. Resistant genes are indicated with red arrowheads. IS elements are indicated in blue. White arrows indicate integron IntI1. The tandem repeat fragment surrounding the blaNDM-1 gene is highlighted with a light grey frame.