Figures & data
Table 1 Primer Sequences for Multiplex Real-Time PCR Target Stress-Related Genes
Table 2 Probes Sequences Used in Multiplex Real-Time PCR Target Stress-Related Genes
Table 3 The Condition for Multiplex Real-Time PCR Assay Target Stress-Related Genes
Table 4 Primer Sequences for ManLAM-Related Genes and Genes Associated with Drug Resistance
Table 5 PCR Conditions for ManLAM-Related Genes Expression Analysis
Table 6 PCR Conditions for DNA Sequencing
Figure 1 The relative expression of hspX (A), tgs1 (B), and sigE (C) of MTB in response to isoniazid treatment. *Significant at ρ < 0.05; **significant at ρ < 0.01 were determined by one-way analysis of variance with Tukey’s multiple comparison.
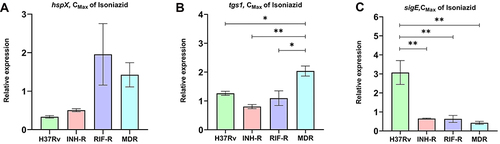
Figure 2 The relative expression of pimB (A), mptA (B), mptC (C), dprE1 (D), dprE2 (E) and embC (F) of MTB fours strain in response to isoniazid treatment. *Significant at ρ < 0.05; **significant at ρ < 0.01; ***significant at ρ < 0.001 were determined by one-way analysis of variance with Tukey’s multiple comparison.
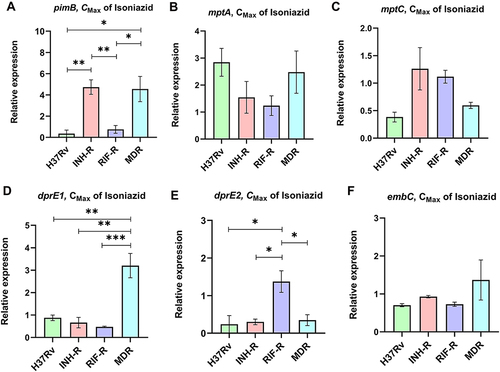
Figure 3 The relative expression of ManLAM-related genes that were up-regulated in INH-R. The relative expression was compared among ManLAM-related genes that were up-regulated in INH-R, including pimB, mptA and mptC. *Significant at ρ < 0.05 was determined by one-way analysis of variance with Tukey’s multiple comparison.
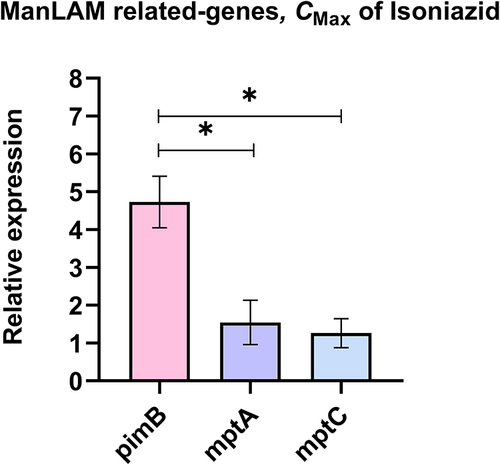
Figure 4 The Venn diagram represents a distinct expression pattern of ManLAM-related genes of drug resistance MTB response to isoniazid treatment. ManLAM-related genes that were up-regulated are listed in each circle that represents each MTB strain. *Represents a gene which is up-regulated in H37Rv (a drug-sensitive strain).
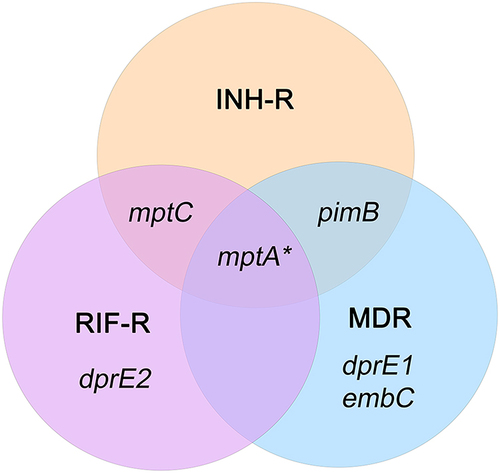
Figure 5 Sequence alignment of inhA for MTB with different drug resistance profiles. *Represents the position of the nucleotide mutation in the inhA regulatory region of INH-R.
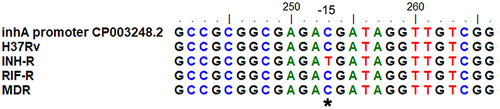
Figure 6 Sequence alignment of rpoB for MTB with different drug resistance profiles. *In the upper part indicates the location of the nucleotide mutation and *in the lower part indicates amino acid substitutions of MDR and RIF-R.
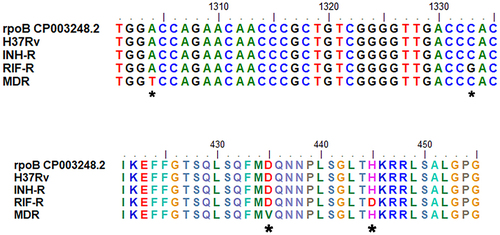
Figure 7 Sequence alignment of katG for MTB with different drug resistance profiles. *In the upper part indicates the location of the nucleotide mutation and *in the lower part indicates amino acid substitutions of MDR.
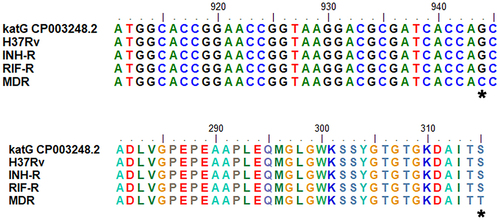
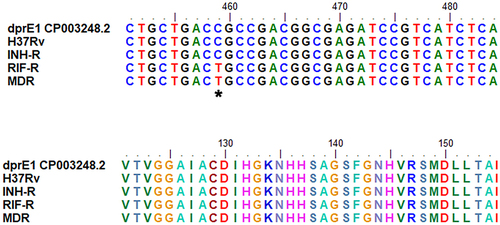
Figure 8 Sequence alignment of dprE1 for MTB with different drug resistance profiles. *Indicates the location of the nucleotide mutation in dprE1 gene of MDR and RIF-R.