
Figures & data
Table 1 Baseline Characteristics of These Patients Among Four Groups
Figure 1 The dynamics of serum creatinine and eGFRcr among four groups (** <0.01,***<0.001; ns: not significant). (A, C, E and G) showed the mean level of serum creatinine from baseline to 48w. (B, D, F and H) showed the mean estimating glomerular filtration rate based on serum creatinine, and the equation used CKD-EPI, was expressed as equation depicted above.
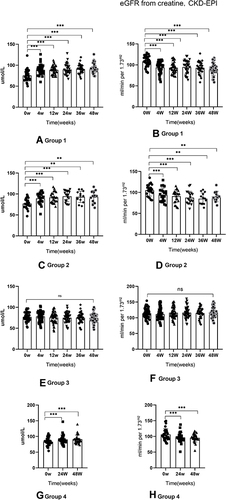
Figure 2 The dynamic of CysC and eGFRCysC among four groups (* <0.05; ** <0.01,***<0.001; ns: not significant). (A, C, E and G) showed the mean level of cystatin C from baseline to 48w. (B, D, F and H) showed the mean estimating glomerular filtration rate based on cystatin C, and the equation used CKD-EPI, was expressed as equation depicted above.
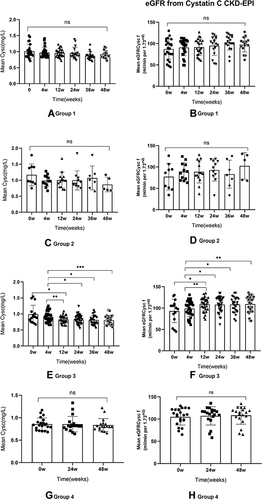
Figure 3 Bland–Altman of consistency between eGFRcr and eGFRCysC among DTG-treatment group (5A, group 1 and group 2) and control group (5B). The horizontal axe is the mean value of eGFRcr and eGFRCysC results and the vertical axe is the difference value of eGFRcr and eGFRCysC. The solid blue lines represent the mean value of the difference. The top and bottom dotted lines are the 95% limits of agreement (95% LoA).
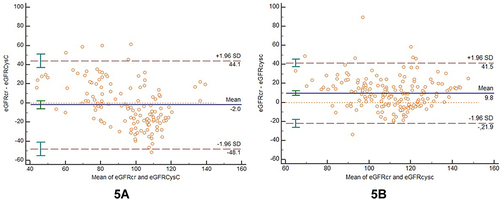
Table 2 Decreased Proportion of eGFRcr (or eGFRCysc) When Compared with Baseline Levels Among Four Groups