Figures & data
Table 1 Baseline Features of Patients Stratified by Quartile of TyG Index
Figure 1 Flow chart of the study population.
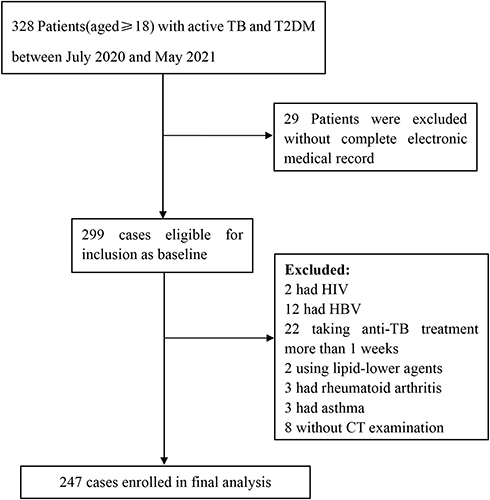
Figure 2 Chest radiograph signs in pulmonary window and mediastinal window. (A) Air bronchial sign. (B) Large segmented leafy shadow. (C) Thick-walled cavity. (D) Multiple cavities. (E) Lymph node enlargement.
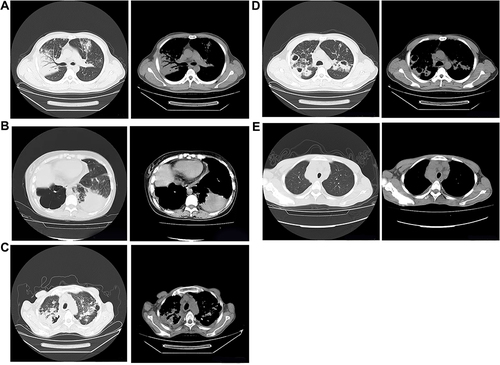
Figure 3 Chest radiograph signs in pulmonary window and mediastinal window.
Table 2 Correlations Between the TyG Index and CT Imaging Features
Table 3 Association of the TyG Index with CT Imaging Features in T2DM-PTB
Figure 4 Forest plot of multivariable logistic regression analysis model in patient with T2DM-TB demonstrating the association between the TyG index and air bronchial sign.
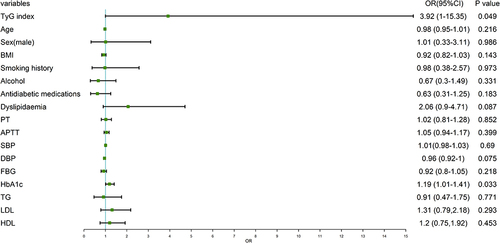
Figure 5 Forest plot of multivariable logistic regression analysis model in patient with T2DM-TB demonstrating the association between the TyG index and multiple cavities.
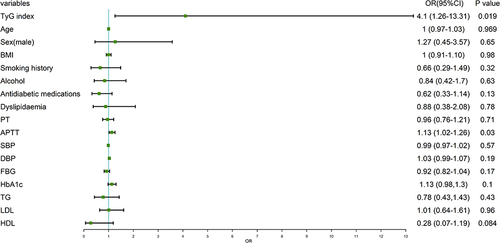
Figure 6 Forest plot of multivariable logistic regression analysis model in patient with T2DM-TB demonstrating the association between the TyG index and thick-walled cavity.
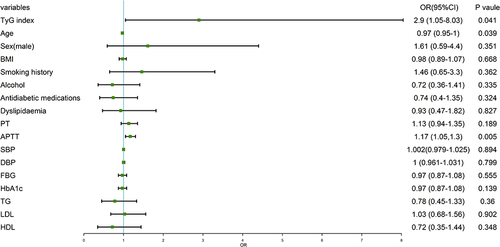
Table 4 ROC Curve Analysis of the TyG Index and CT Imaging Features in T2DM-PTB
Figure 7 ROC curve of the TyG index to predict the CT features. (A) Roc curve of air bronchial sign. (B) Roc curve of thick-walled cavity. (C) Roc curve of multiple cavities.
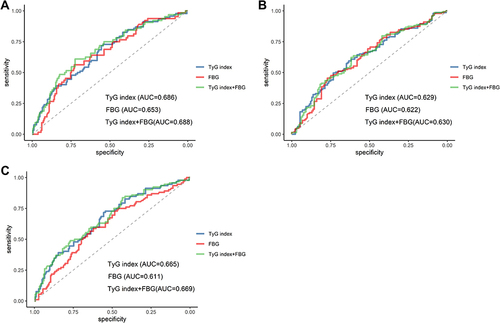
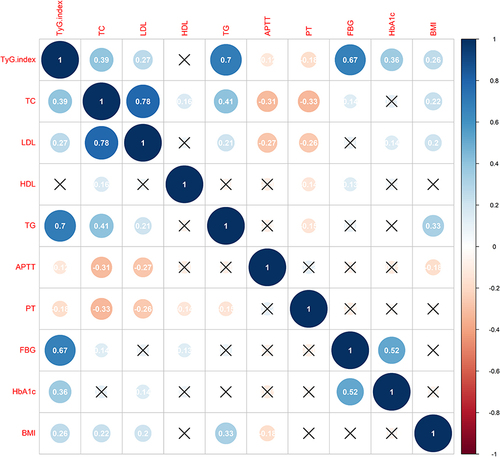
Figure 8 Corrplot of studied associations between the TyG index, lipid-metabolic and hypercoagulation risk factors. Blue colour represents positive correlation; red colour represents negative correlation; darker colors and larger shapes represent higher association. х represents no statistical difference.