Figures & data
Figure 1 (A) Schematic representation of the creation of recombinant E2-E1 from full-length structural E2 and E1 genes. (B) Identification of ectodomain sequence of E2 (a) and E1 (b) by TMHMM server v.2.0 software.
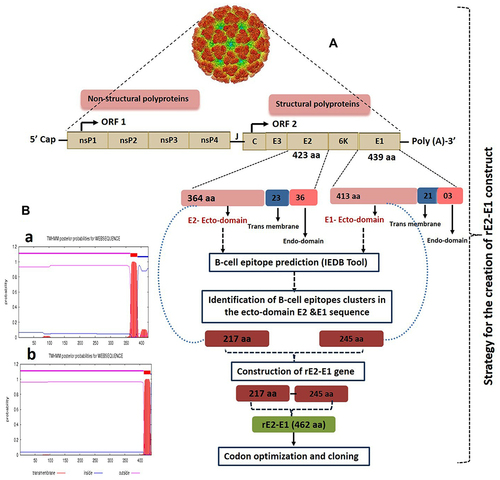
Figure 2 Scheme of recombinant E2-E1 gene sequence alignment for non-optimized genes (NOG) and codon-optimized genes (COG) of CHIKV. Alignment of nucleotide sequence and amino acid sequence of the recombinant NOG E2-E1 gene (accession no. KX619424) and COG (accession no. MZ130655) of CHIKV.
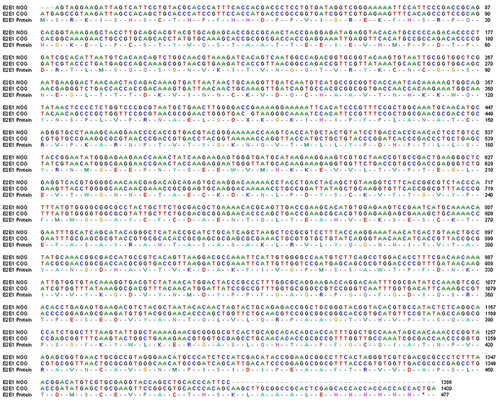
Figure 3 Appraisal of the features of rE2-E1 epitopes. (A) Antigenicity: Kolaskar and Tongaonkar antigenicity prediction. Sequence position and antigenic propensity are shown on the x-axis and y-axis, respectively, and the threshold value is 1.0. (B) Surface accessibility: Emini surface accessibility prediction. The sequence position and surface probability are shown on the x- and y-axis, respectively, and the threshold value is 1.0. (C) Hydrophilicity: Parker hydrophilicity prediction. The position and score are shown on the x- and y-axis, respectively, and the threshold value is 2.0. (D) Chou and Fasman β-turn prediction. The position and score are shown on the x- and y-axis, respectively, and the threshold value is 1.0. (E) Karplus and Schulz flexibility prediction. The position and score are shown on the x- and y-axis, respectively, and the threshold value is 1.0. (F) BepiPred linear epitope prediction: position and score are shown on the x- and y-axis, respectively, and the threshold value is 0.5.
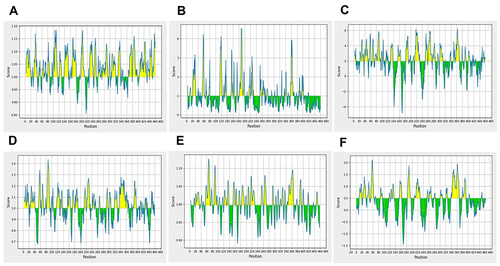
Figure 4 (A) Agarose gel analysis showing isolated plasmid. Lane 1 represents pET28a insert with E2-E1 from transformed BL21; lane 2 represents restriction digestion of E2-E1 with BamHI and HindIII, respectively. (B) Analysis of SDS-PAGE showing expression of recombinant E2-E1 protein (51 kDa) of CHIKV induced by IPTG at 37°C. Lanes 1, 2, 3, and 4 represent the vector without insert, molecular weight marker (kDa), pellet induced with 0.5 mM IPTG, and uninduced bacterial pellet, respectively. (C) Western blot hybridization was performed using anti-His tag antibody to confirm the recombinant E2-E1 protein expression after induction with 0.5 mM IPTG at 37°C. Lane 1 represents expressed rE2-E1 protein (51 kDa); lane 2 indicates molecular weight marker. (D) SDS-PAGE gel image representing the elution profile of Ni-NTA column chromatography. Lanes 1, 2, 3, 4, and 5 indicate molecular weight marker, and elution with 100, 150, 300, and 500 mM imidazole, respectively. (E) Western blot profile of purified rE2-E1. Lane 1 represents molecular weight marker; lane 2 represents purified rE2-E1 of molecular mass ~51 kDa.
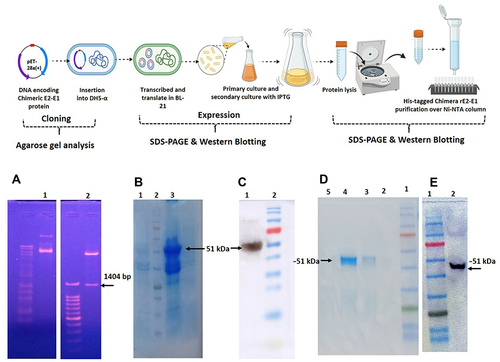
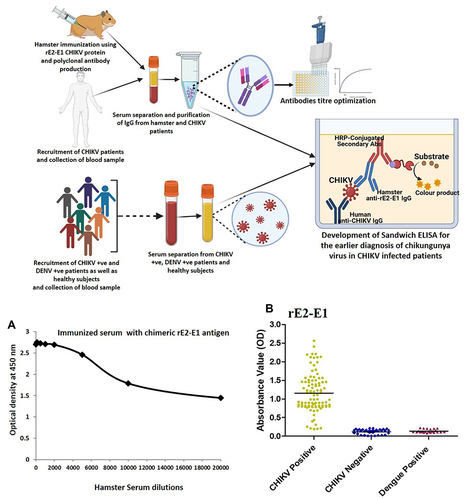
Figure 5 (A) Optimization of anti-rE2-E1 hamster antibody concentration utilizing indirect ELISA. Serial dilution of anti-rCHIKV E2-E1 hamster antibody (1:2000, 1:4000, 1:6000, 1:8000, 1:10,000, 1:12,000, 1:14,000, 1:16,000, 1:18,000, and 1:20,000) was applied for the detection of viral antigens (CHIKV). (B) Assessment of sandwich ELISA utilizing anti-CHIKV human antibody and anti-rCHIKV E2-E1 hamster antibody. In total, 96 CHIKV-positive serum samples, 36 CHIKV-negative serum samples, and 22 dengue-positive serum samples were evaluated. The absorbance was determined at 450 nm.