Figures & data
Table 1 Baseline Characteristics of Patients in Training Cohort and Validation Cohort
Table 2 Univariate and Multivariable Logistic Regression Analysis of the Training Cohort
Figure 1 ROC curves of the nomogram, FPG, PLT, D-dimer, and cTnI in the training and validation cohorts. (A) ROC curve in training cohort. (B) ROC curve in validation cohort.
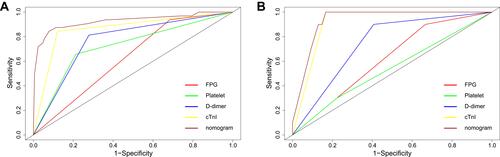
Figure 2 The nomogram predicts the probability of hospitalized COVID-19 patients progressing to ARDS. The score for each value is assigned by drawing a line upward to the points line, and the sum of the four scores is plotted on the Total points line.
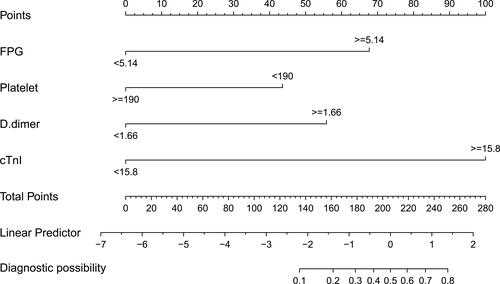
Figure 3 Calibration plots for predicting the rate of ARDS in the training and validation cohort. (A) Calibration plot in training cohort. (B) Calibration plot in validation cohort.
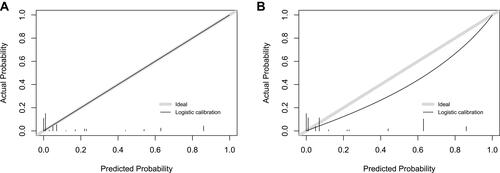
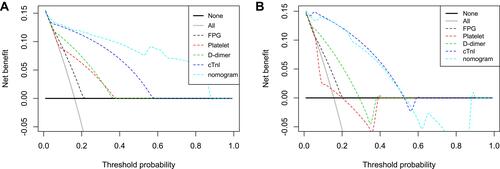
Figure 4 The decision curves analysis curves for nomogram in the training and validation cohort. (A) DCA curve in training cohort. (B) DCA curve in validation cohort.