Figures & data
Table 1 Clinical Characteristic of Cystic Fibrosis Patients from Which Pseudomonas aeruginosa Strains Used for Anti-Biofilm Studies Were Isolated
Table 2 Antibiotic Sensitivity of Pseudomonas aeruginosa Strains Isolated from Cystic Fibrosis Patients. Antimicrobial Susceptibility of Pseudomonas Strains Used in This Study Was Estimated Using VITEK® 2 AST-N331 Cards Designated for VITEK®2 Compact System
Figure 1 Physicochemical properties of the developed gold nanopaenuts (AuP NPs; panels A1 and B1), gold nanostars (AuS NPs; panels A2 and B2) and spherical, porous nanoparticles (AuSph (70C) NPs; panels A3 and B3). High-angle annular dark-field scanning transmission electron microscopy (HAADF-STEM) overview (A). Size distribution of obtained Au NPs is presented in (B).
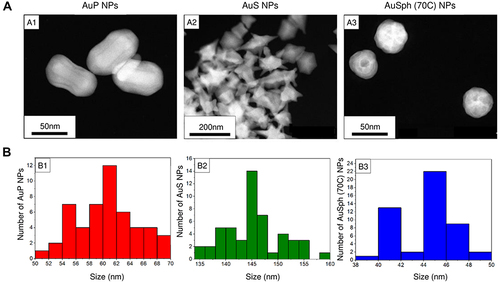
Table 3 Minimal Inhibitory Concentrations (MIC; Ng/mL) of Peanut-Shaped (AuP NPs), Star-Shaped (AuS NPs) and Porous Spherical-Like Gold Nanoparticles [AuSph (70C) NPs] Against Clinical Strains of Pseudomonas aeruginosa Isolated from Patients with Cystic Fibrosis
Figure 2 Bactericidal activity of gold nanoparticles having the shape of peanuts (AuP NPs; (A and B)), stars (AuS NPs; (C and D)) and spherical, porous nanoparticles (AuSph (70C) NPs; panels E-F) against 10 clinical strains of P. aeruginosa isolated from the sputum collected from the lung of cystic fibrosis patients. Strains were divided into non-MDR (A, C and E) and MDR-strains (B, D and F). Results are presented as mean ± SD. *Indicates statistical significance (p<0.05) when compared to untreated control.
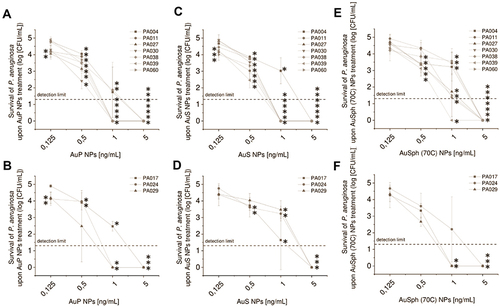
Figure 3 Anti-biofilm activity of gold nanoparticles having the shape of peanuts (AuP NPs), stars (AuS NPs) and spherical, porous nanoparticles (AuSph (70C) NPs) against 10 clinical strains of P. aeruginosa isolated from sputum collected from the lung of cystic fibrosis patients. The ability of the tested nanoparticles to prevent biofilm formation (A) was investigated using resazurin staining. Au NPs concentration required to prevent biofilm formation by 50% was calculated from interpolation of dose-response curves recorded for each nanoparticles tested. Live/dead staining of biofilms formed and disrupted upon incubation with AuP NPs at doses of 5 and 25 ng/mL is presented in (B). Green color indicates SYTO9-positive viable cells, red color – PI-positive dead cells. For (A), the results are shown as mean ± SE. For (B), the results from one representative experiment are shown.
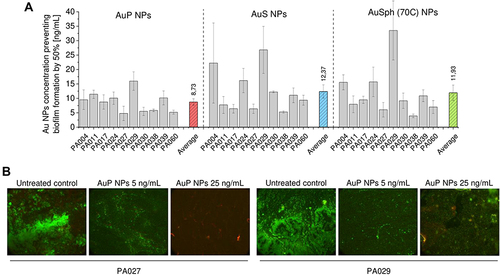
Figure 4 Anti-biofilm activities of gold nanoparticles having the shape of peanuts (AuP NPs), stars (AuS NPs) and spherical, porous nanoparticles (AuSph (70C) NPs) against multispecies biofilms. Decreased formation of biofilms by P. aeruginosa mixed with S. aureus (SA) isolates or P. aeruginosa mixed with C. albicans (SA) isolates upon treatment with tested nanoparticles at doses of 0.5, 5 and 25 ng/mL is presented in (A–C) and (D–F), respectively. (G) demonstrates the formation of mixed biofilms calculated as average from 10 tested P. aeruginosa strains. The results are presented as mean ± SE. *Indicates statistical significance (p<0.05) when compared to untreated control.
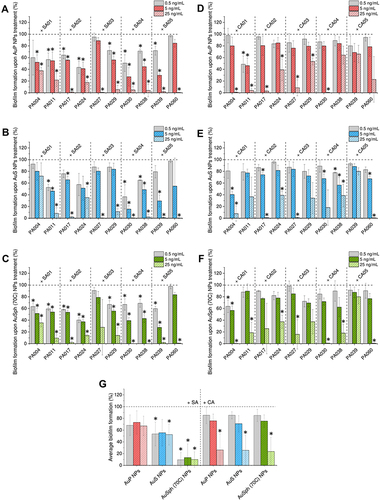
Figure 5 Ability of gold nanoparticles having the shape of peanuts (AuP NPs), stars (AuS NPs) and spherical, porous nanoparticles (AuSph (70C) NPs) to prevent formation of biofilms by P. aeruginosa in the presence of biofilm-promoting factors: 1 mg/mL DNA, 180 mM sodium chloride (NaCl, ionic strength I = 0.18) or 1 mM magnesium divalent ions (Mg2+, I = 0.002). Au NPs concentration required to prevent biofilm formation by 50% (EC50%) was calculated from interpolation of dose-response curves recorded for each nanoparticles tested. Alterations in EC50% for each tested strain are presented in (A) using heatmap plot with red and blue colors indicating the increase and decrease of EC50%, respectively, when compared to biofilms formed in LB medium without supplements. The average EC50% for all tested P. aeruginosa strains and average biofilm formation upon treatment with 25 ng/mL of Au NPs are presented in (B and C). The results are presented as mean ± SE. * indicates statistical significance (p<0.05) when compared to untreated control.
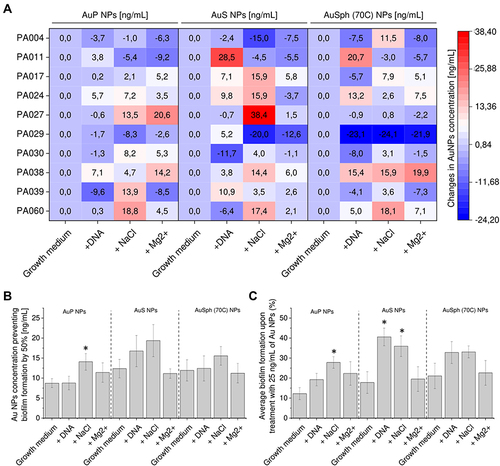
Figure 6 Improvement of therapeutic efficiency of gold nanopeanuts (AuP NPs) in the presence of N-acetyl-cysteine (NAC). Relative inhibitory effect of AuP NPs (at concentrations of 0.5, 5 and 25 ng/mL) when combined with NAC (at doses of 0.5, 1 and 2.5 μg/mL) compared to treatment with AuP NPs alone is presented in (A) using heatmap plot type with blue and red colors indicating improvement and decrease of therapeutic efficiency, respectively. (B) demonstrates formation of biofilms by three drug-resistant P. aeruginosa strains (PA017, PA024, PA029) upon treatment with NAC and AuP NPs alone or when combined. Results are presented as mean from 3 independent replicates.
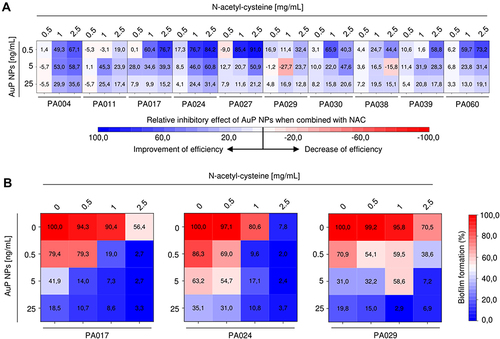
Figure 7 Effects of NAC and AuP NPs on rheological properties of Pseudomonas aeruginosa biofilm: (A) dynamic viscosity (mean values) as a function of shear rate for control samples, and samples treated with NAC and AuP NPs; (B) zero-shear viscosity η0 and infinity-shear viscosity η∞ determined from the viscosity curves; (C) compliance as a function of time in creep-recovery tests of samples subjected to 0.1 Pa stress; (D) mean maximal creep compliance values (at 30s Jt=30s) and the ratio of difference between Jt=30s and unrecovered creep compliance (at 90s Jt=90s) to maximal creep compliance calculated from creep-recovery curves. * indicates statistical significance (p<0.05) when compared to untreated control.
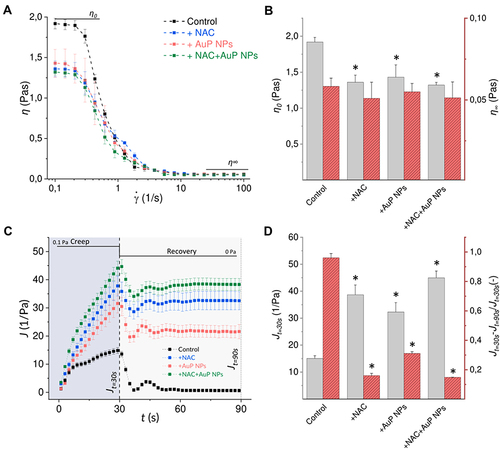
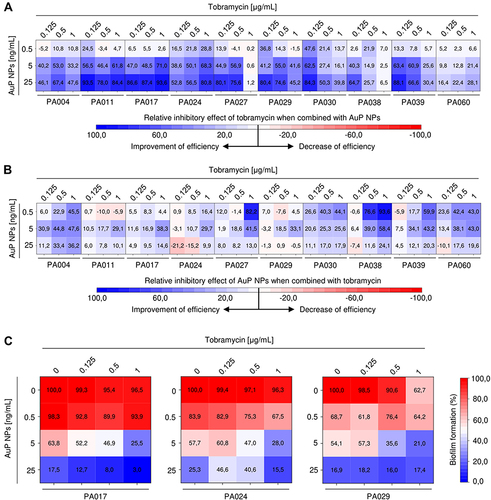
Figure 8 Improvement of therapeutic efficiency of tobramycin and AuP NPs when combined together. Relative inhibitory effect of tobramycin (at concentrations of 0.125, 0.5 and 1 µg/mL) and AuP NPs (at doses of 0.5, 5 and 25 ng/mL) compared to single-agent treatment is presented in (A and B) using heatmap plot type with blue and red colors indicating the improvement and decrease of therapeutic efficiency, respectively. (C) demonstrates the formation of biofilms by three tobramycin-resistant P. aeruginosa strains (PA017, PA024, PA029) upon treatment with tobramycin and AuP NPs alone or when combined. The results are presented as mean from 3 independent replicates.