
Figures & data
Figure 1 Geographical location of the study areas.
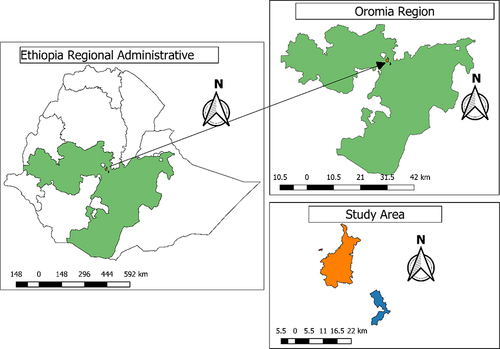
Table 1 Primers Used to Detect Salmonella
Table 2 Socio-Demographic Characteristics of Human Study Participants in Selected Export Abattoirs, East Shewa, Ethiopia, from January to October 2020
Table 3 Detection Rate of Salmonella on Different Samples in Selected Export Abattoirs, East Shewa, Ethiopia, from January to October 2020
Figure 2 Agarose gel electrophoresis result of PCR product. Legend. Electrophoresis of PCR amplification after serial dilution of Salmonella sample in a 0.5% agarose gel stained with ethidium bromide. Agarose gel electrophoresis of Salmonella PCR products at 496 bp (16SrRNA gene) amplification of target region of histidine transport operon.
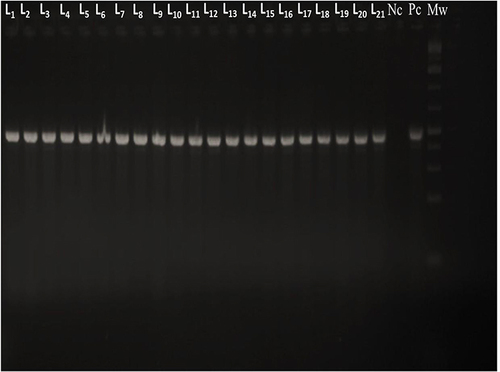
Table 4 Antibiotic Susceptibility Profiles of Salmonella Isolates (n=21) in Selected Export Abattoirs, East Shewa, Ethiopia, from January to October 2020
Table 5 Drug-Resistance Patterns of Salmonella Isolates from Studied Ethiopian Export Abattoirs from January to October 2020