Figures & data
Figure 1 Flowchart of swabs collected from the ICU. The study was conducted between May 2020 and August 2020.
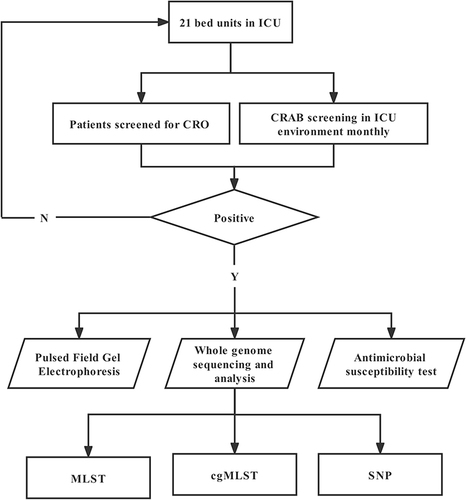
Figure 2 Months of isolation of 18 CRAB strains. The upper one is the time of clinical specimen isolation, and the lower Ea-1~Eb-5 stand for the samples collected from environment.
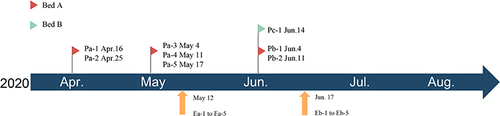
Table 1 CRAB Isolates from the ICU Settings
Figure 3 Antimicrobial drug sensitivity results and distribution of drug resistance genes. According to CLSI2020 criteria, polymyxin B with MIC ≤ 2 mg/L is considered intermediate and MIC ≥ 4 mg/L is considered resistant.
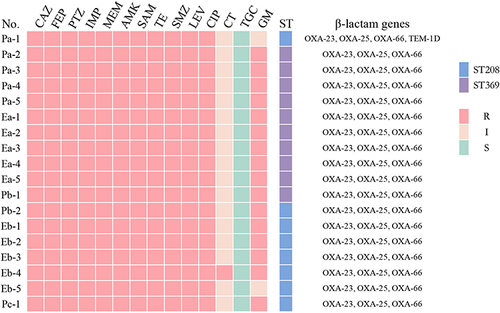
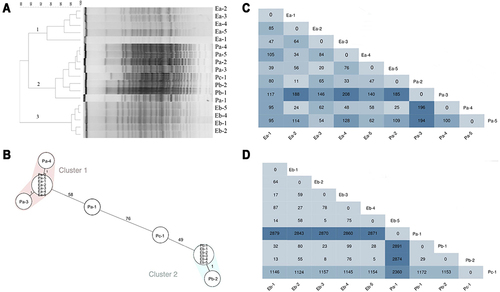
Figure 4 Relationships among CRAB isolates via PFGE, cgMLST, and SNP. (A) PFGE patterns for selected commonly occurring PFGE types. (B) Minimum spanning tree, based on the core genome of 18 A. baumannii isolates. Colours indicate different STs according to the MLST Oxford scheme (pink shade indicates ST208 and blue shade indicates ST369). The cluster distance threshold is 9 alleles. Each circle represents one or multiple identical sequences. (C) ST369 SNP The number of SNPs between each ST369 CRAB strain heatmap. (D) The number of SNPs between each ST208 CRAB strain heatmap. The deeper the color is, the larger the SNP quantity scale.