
Figures & data
Table 1 Clinical Characteristics of the Included Patients
Figure 1 Diagnostic classification of the study participants.
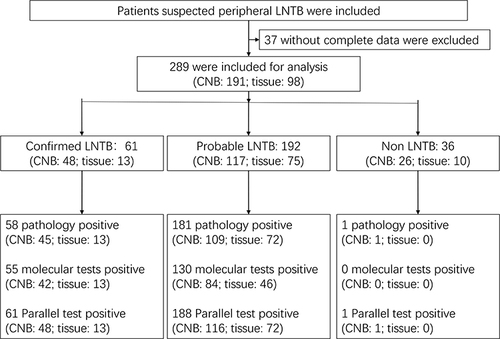
Figure 2 Venn diagram of positive tests. (A) All specimens. (B) Tissue specimens. (C) Core needle biopsy specimens.
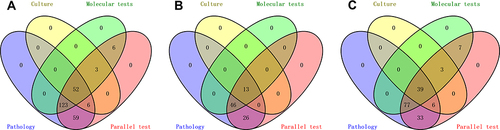
Table 2 Accuracy of Pathology, Molecular Tests, and Parallel Test (Positive Result for Either of the Two Assays) for the Diagnosis of Lymph Node Tuberculosis Against a Composite Reference Standard
Table 3 Comparison of the Diagnostic Efficiency Between Pathology, Molecular Tests, and Parallel Test for the Diagnosis of Lymph Node Tuberculosis
Table 4 Comparison of the Diagnostic Efficiency of Pathology, Molecular Tests, and Parallel Test Using Different Specimen Types for the Diagnosis of Lymph Node Tuberculosis